Published on August 14, 2024
Exhibit 99.2
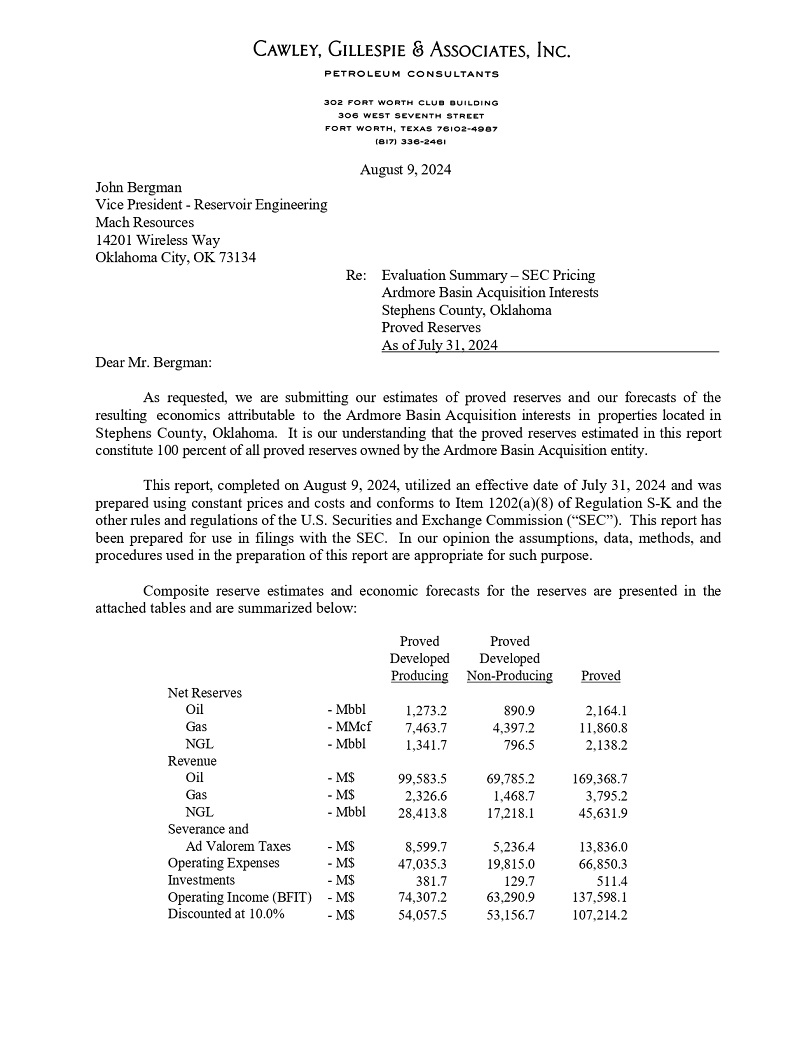
A ugu s t 9 , 2 0 24 J oh n B e r g m a n V i c e P r e s i d e n t - R e s e r v o i r E n g i n e e r i n g Mach Resources 14201 Wireless Way O k l a h om a Ci t y , O K 7 31 34 Re : Evaluation Summary – SEC Pricing Ardmore Basin Acquisition Interests Stephens County, Oklahoma P ro v e d R e s e r v e s As of July 31 , 2024 Dear Mr . Bergman : As requested, we are submitting our estimates of proved reserves and our forecasts of the resulting economics attributable to the Ardmore Basin Acquisition interests in properties located in Stephens County, Oklahoma . It is our understanding that the proved reserves estimated in this report constitute 100 percent of all proved reserves owned by the Ardmore Basin Acquisition entity . This report, completed on August 9 , 2024 , utilized an effective date of July 31 , 2024 and was prepared using constant prices and costs and conforms to Item 1202 (a)( 8 ) of Regulation S - K and the other rules and regulations of the U . S . Securities and Exchange Commission (“SEC”) . This report has been prepared for use in filings with the SEC . In our opinion the assumptions, data, methods, and procedures used in the preparation of this report are appropriate for such purpose . Composite reserve estimates and economic forecasts for the reserves are presented in the attached tables and are summarized below : Proved Proved Developed Developed Proved Non - Producing Producing Net Reserves 2,164.1 890.9 1,273.2 - Mbbl Oil 11,860.8 4,397.2 7,463.7 - MMcf Gas 2,138.2 796.5 1,341.7 - Mbbl NGL Revenue 169,368.7 69,785.2 99,583.5 - M$ Oil 3,795.2 1,468.7 2,326.6 - M$ Gas 45,631.9 17,218.1 28,413.8 - Mbbl NGL Severance and 13,836.0 5,236.4 8,599.7 - M$ Ad Valorem Taxes 66,850.3 19,815.0 47,035.3 - M$ Operating Expenses 511.4 129.7 381.7 - M$ Investments 137,598.1 63,290.9 74,307.2 - M$ Operating Income (BFIT) 107,214.2 53,156.7 54,057.5 - M$ Discounted at 10.0%
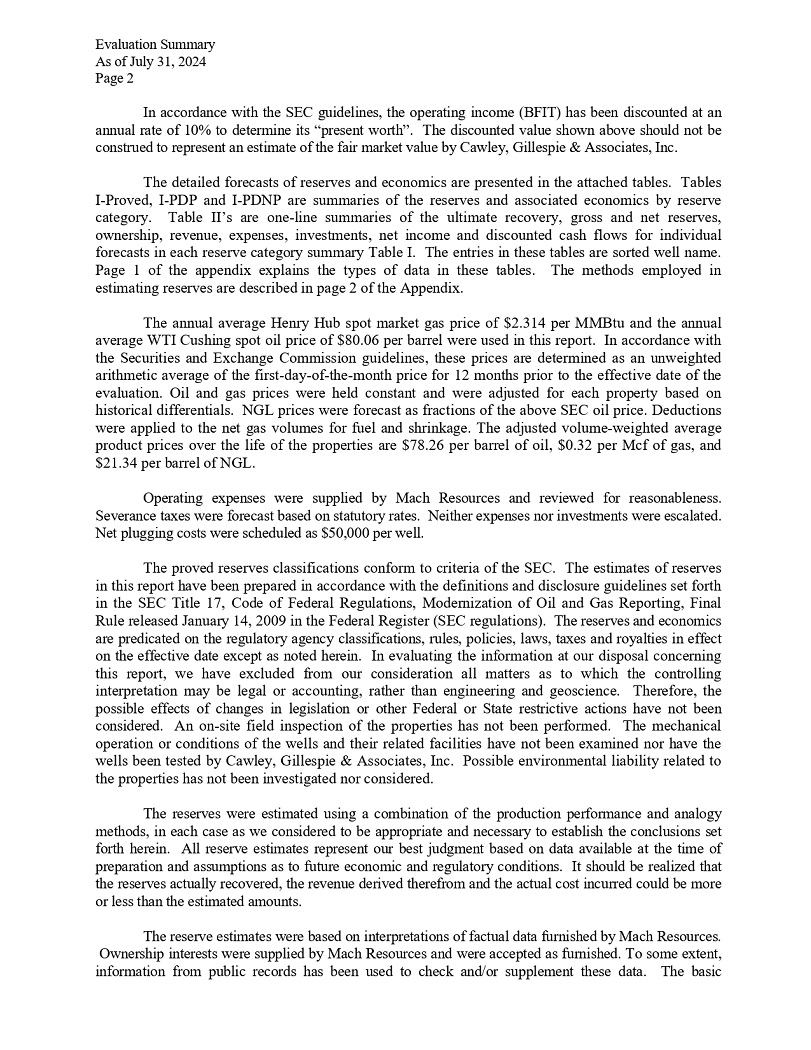
Ev a l ua t i o n S u mm a r y As of July 31, 2024 P a g e 2 In accordance with the SEC guidelines, the operating income (BFIT) has been discounted at an annual rate of 10 % to determine its “present worth” . The discounted value shown above should not be construed to represent an estimate of the fair market value by Cawley, Gillespie & Associates, Inc . The detailed forecasts of reserves and economics are presented in the attached tables . Tables I - Proved, I - PDP and I - PDNP are summaries of the reserves and associated economics by reserve category . Table II’s are one - line summaries of the ultimate recovery, gross and net reserves, ownership, revenue, expenses, investments, net income and discounted cash flows for individual forecasts in each reserve category summary Table I . The entries in these tables are sorted well name . Page 1 of the appendix explains the types of data in these tables . The methods employed in estimating reserves are described in page 2 of the Appendix . The annual average Henry Hub spot market gas price of $ 2 . 314 per MMBtu and the annual average WTI Cushing spot oil price of $ 80 . 06 per barrel were used in this report . In accordance with the Securities and Exchange Commission guidelines, these prices are determined as an unweighted arithmetic average of the first - day - of - the - month price for 12 months prior to the effective date of the evaluation . Oil and gas prices were held constant and were adjusted for each property based on historical differentials . NGL prices were forecast as fractions of the above SEC oil price . Deductions were applied to the net gas volumes for fuel and shrinkage . The adjusted volume - weighted average product prices over the life of the properties are $ 78 . 26 per barrel of oil, $ 0 . 32 per Mcf of gas, and $ 21 . 34 per barrel of NGL . Operating expenses were supplied by Mach Resources and reviewed for reasonableness . Severance taxes were forecast based on statutory rates . Neither expenses nor investments were escalated . Net plugging costs were scheduled as $ 50 , 000 per well . The proved reserves classifications conform to criteria of the SEC . The estimates of reserves in this report have been prepared in accordance with the definitions and disclosure guidelines set forth in the SEC Title 17 , Code of Federal Regulations, Modernization of Oil and Gas Reporting, Final Rule released January 14 , 2009 in the Federal Register (SEC regulations) . The reserves and economics are predicated on the regulatory agency classifications, rules, policies, laws, taxes and royalties in effect on the effective date except as noted herein . In evaluating the information at our disposal concerning this report, we have excluded from our consideration all matters as to which the controlling interpretation may be legal or accounting, rather than engineering and geoscience . Therefore, the possible effects of changes in legislation or other Federal or State restrictive actions have not been considered . An on - site field inspection of the properties has not been performed . The mechanical operation or conditions of the wells and their related facilities have not been examined nor have the wells been tested by Cawley, Gillespie & Associates, Inc . Possible environmental liability related to the properties has not been investigated nor considered . The reserves were estimated using a combination of the production performance and analogy methods, in each case as we considered to be appropriate and necessary to establish the conclusions set forth herein . All reserve estimates represent our best judgment based on data available at the time of preparation and assumptions as to future economic and regulatory conditions . It should be realized that the reserves actually recovered, the revenue derived therefrom and the actual cost incurred could be more or less than the estimated amounts . The reserve estimates were based on interpretations of factual data furnished by Mach Resources . Ownership interests were supplied by Mach Resources and were accepted as furnished . To some extent, information from public records has been used to check and/or supplement these data . The basic

Ev a l ua t i o n S u mm a r y As of July 31, 2024 P a g e 3 engineering and geological data were utilized subject to third party reservations and qualifications . Nothing has come to our attention, however, that would cause us to believe that we are not justified in relying on such data . An on - site inspection of these properties has not been made nor have the wells been tested by Cawley, Gillespie & Associates, Inc . Cawley, Gillespie & Associates, Inc . is independent with respect to Mach Resources as provided in the Standards Pertaining to the Estimating and Auditing of Oil and Gas Reserve Information promulgated by the Society of Petroleum Engineers (“SPE Standards”) . Neither Cawley, Gillespie & Associates, Inc . nor any of its employees has any interest in the subject properties . Neither the employment to make this study nor the compensation is contingent on the results of our work or the future production rates for the subject properties . Our work papers and related data are available for inspection and review by authorized parties. Respectfully submitted, CAWLEY, GILLESPIE & ASSOCIATES, INC. Texas Registered Engineering Firm F - 693 J ZM : p t n
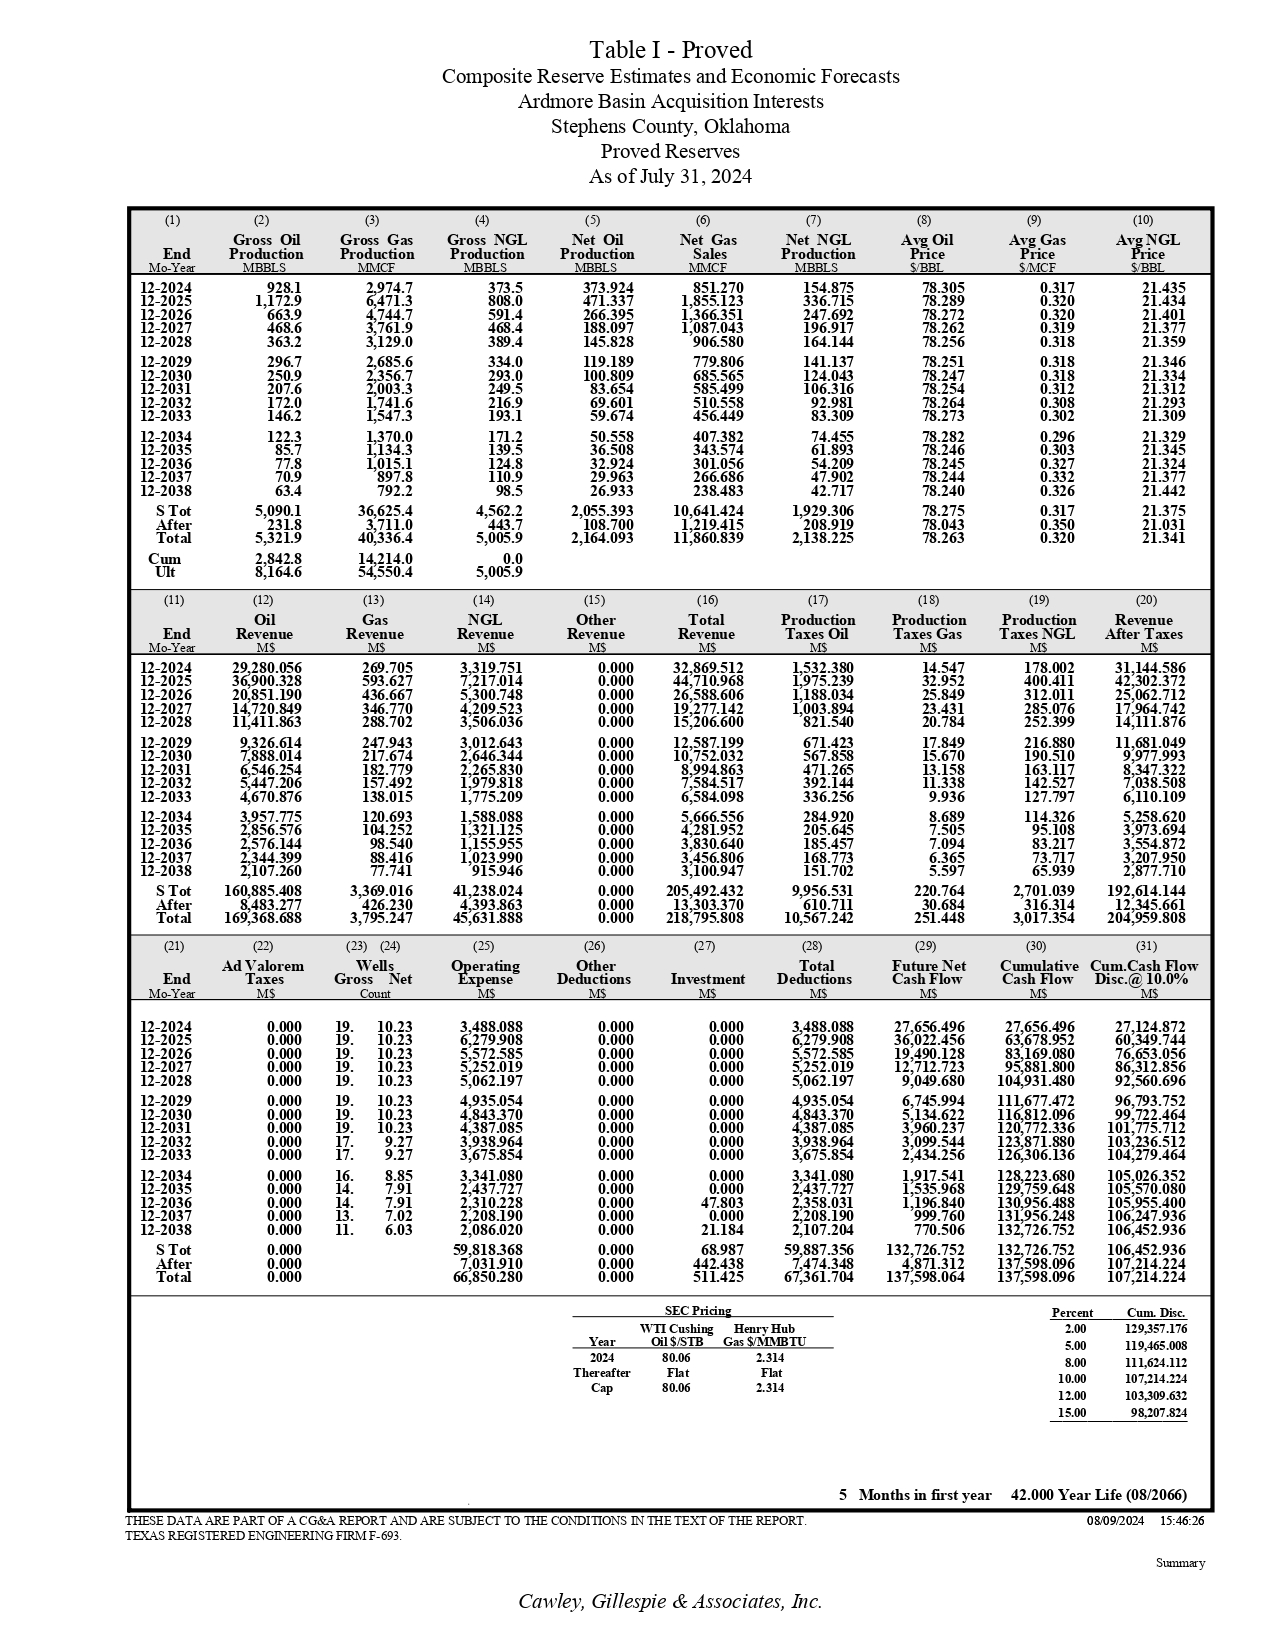
(8) (9) (10) Av g Oil Av g Gas Av g NGL Price Price Price $/BBL $/MCF $/BBL (5) (6) (7) Net Oil Net Gas Net NGL Production Sale s Production MBBLS MMCF MBBLS (4) Gross NGL Production MBBLS (3) Gross Gas Production MMCF (2) Gross Oil Production MBBLS (1) End Mo - Year 78.305 0.317 21.435 78.289 0.320 21.434 78.272 0.320 21.401 78.262 0.319 21.377 78.256 0.318 21.359 78.251 0.318 21.346 78.247 0.318 21.334 78.254 0.312 21.312 78.264 0.308 21.293 78.273 0.302 21.309 78.282 0.296 21.329 78.246 0.303 21.345 78.245 0.327 21.324 78.244 0.332 21.377 78.240 0.326 21.442 78.275 0.317 21.375 78.043 0.350 21.031 78.263 0.320 21.341 373.924 851.270 154.875 471.337 1,855.123 336.715 266.395 1,366.351 247.692 188.097 1,087.043 196.917 145.828 906.580 164.144 119.189 779.806 141.137 100.809 685.565 124.043 83.654 585.499 106.316 69.601 510.558 92.981 59.674 456.449 83.309 50.558 407.382 74.455 36.508 343.574 61.893 32.924 301.056 54.209 29.963 266.686 47.902 26.933 238.483 42.717 2,055.393 10,641.424 1,929.306 108.700 1,219.415 208.919 2,164.093 11,860.839 2,138.225 373.5 808.0 591.4 468.4 389.4 334.0 293.0 249.5 216.9 193.1 171.2 139.5 124.8 110.9 98.5 4,562.2 443.7 5,005.9 0.0 5,005.9 2,974.7 6,471.3 4,744.7 3,761.9 3,129.0 2,685.6 2,356.7 2,003.3 1,741.6 1,547.3 1,370.0 1,134.3 1,015.1 897.8 792.2 36,625.4 3,711.0 40,336.4 14,214.0 54,550.4 928.1 1,172.9 663.9 468.6 363.2 296.7 250.9 207.6 172.0 146.2 122.3 85.7 77.8 70.9 63.4 5,090.1 231.8 5,321.9 2,842.8 8,164.6 12 - 2024 12 - 2025 12 - 2026 12 - 2027 12 - 2028 12 - 2029 12 - 2030 12 - 2031 12 - 2032 12 - 2033 12 - 2034 12 - 2035 12 - 2036 12 - 2037 12 - 2038 S Tot After Total Cum Ult (18) (19) (20) (15) (16) (17) Other Total Production Revenue Revenue Taxes Oil M$ M$ M$ (14) (13) (12) (11) Production Production Revenue Taxes Gas Taxes NG L Afte r Taxes M$ M$ M$ NGL Revenue M$ Gas Revenue M$ Oil Revenue M$ End Mo - Year 14.547 178.002 31,144.586 32.952 400.411 42,302.372 25.849 312.011 25,062.712 23.431 285.076 17,964.742 20.784 252.399 14,111.876 17.849 216.880 11,681.049 15.670 190.510 9,977.993 13.158 163.117 8,347.322 11.338 142.527 7,038.508 9.936 127.797 6,110.109 8.689 114.326 5,258.620 7.505 95.108 3,973.694 7.094 83.217 3,554.872 6.365 73.717 3,207.950 5.597 65.939 2,877.710 220.764 2,701.039 192,614.144 30.684 316.314 12,345.661 251.448 3,017.354 204,959.808 0.000 32,869.512 1,532.380 0.000 44,710.968 1,975.239 0.000 26,588.606 1,188.034 0.000 19,277.142 1,003.894 0.000 15,206.600 821.540 0.000 12,587.199 671.423 0.000 10,752.032 567.858 0.000 8,994.863 471.265 0.000 7,584.517 392.144 0.000 6,584.098 336.256 0.000 5,666.556 284.920 0.000 4,281.952 205.645 0.000 3,830.640 185.457 0.000 3,456.806 168.773 0.000 3,100.947 151.702 0.000 205,492.432 9,956.531 0.000 13,303.370 610.711 0.000 218,795.808 10,567.242 3,319.751 7,217.014 5,300.748 4,209.523 3,506.036 3,012.643 2,646.344 2,265.830 1,979.818 1,775.209 1,588.088 1,321.125 1,155.955 1,023.990 915.946 41,238.024 4,393.863 45,631.888 269.705 593.627 436.667 346.770 288.702 247.943 217.674 182.779 157.492 138.015 120.693 104.252 98.540 88.416 77.741 3,369.016 426.230 3,795.247 29,280.056 36,900.328 20,851.190 14,720.849 11,411.863 9,326.614 7,888.014 6,546.254 5,447.206 4,670.876 3,957.775 2,856.576 2,576.144 2,344.399 2,107.260 160,885.408 8,483.277 169,368.688 12 - 2024 12 - 2025 12 - 2026 12 - 2027 12 - 2028 12 - 2029 12 - 2030 12 - 2031 12 - 2032 12 - 2033 12 - 2034 12 - 2035 12 - 2036 12 - 2037 12 - 2038 S Tot After Total (29) (30) (31) Future Net Cumulative Cum.Cash Flow Cash Flow Cash Flow Disc.@ 10.0% M$ M$ M$ (26) (27) (28) (25) (23) (24) (22) (21) Other Total Deductions Investment Deductions M$ M$ M$ Operating Expense M$ Wells Gross Net Count A d Valorem Taxes M$ End Mo - Year 27,656.496 27,656.496 27,124.872 36,022.456 63,678.952 60,349.744 19,490.128 83,169.080 76,653.056 12,712.723 95,881.800 86,312.856 9,049.680 104,931.480 92,560.696 6,745.994 111,677.472 96,793.752 5,134.622 116,812.096 99,722.464 3,960.237 120,772.336 101,775.712 3,099.544 123,871.880 103,236.512 2,434.256 126,306.136 104,279.464 1,917.541 128,223.680 105,026.352 1,535.968 129,759.648 105,570.080 1,196.840 130,956.488 105,955.400 999.760 131,956.248 106,247.936 770.506 132,726.752 106,452.936 132,726.752 132,726.752 106,452.936 4,871.312 137,598.096 107,214.224 137,598.064 137,598.096 107,214.224 0.000 0.000 3,488.088 0.000 0.000 6,279.908 0.000 0.000 5,572.585 0.000 0.000 5,252.019 0.000 0.000 5,062.197 0.000 0.000 4,935.054 0.000 0.000 4,843.370 0.000 0.000 4,387.085 0.000 0.000 3,938.964 0.000 0.000 3,675.854 0.000 0.000 3,341.080 0.000 0.000 2,437.727 0.000 47.803 2,358.031 0.000 0.000 2,208.190 0.000 21.184 2,107.204 0.000 68.987 59,887.356 0.000 442.438 7,474.348 0.000 511.425 67,361.704 3,488.088 6,279.908 5,572.585 5,252.019 5,062.197 4,935.054 4,843.370 4,387.085 3,938.964 3,675.854 3,341.080 2,437.727 2,310.228 2,208.190 2,086.020 59,818.368 7,031.910 66,850.280 19. 10.23 19. 10.23 19. 10.23 19. 10.23 19. 10.23 19. 10.23 19. 10.23 19. 10.23 17. 9.27 17. 9.27 16. 8.85 14. 7.91 14. 7.91 13. 7.02 11. 6.03 0.000 0.000 0.000 0.000 0.000 0.000 0.000 0.000 0.000 0.000 0.000 0.000 0.000 0.000 0.000 0.000 0.000 0.000 12 - 2024 12 - 2025 12 - 2026 12 - 2027 12 - 2028 12 - 2029 12 - 2030 12 - 2031 12 - 2032 12 - 2033 12 - 2034 12 - 2035 12 - 2036 12 - 2037 12 - 2038 S Tot After Total SE C Pricing Percent Cum . Disc. WTI Cushin g Henry Hub 2.00 129,357.176 Year Oil $/STB Gas $/MMBTU 5.00 119,465.008 2024 80.06 2.314 8.00 111,624.112 Thereafter Flat Flat 10.00 107,214.224 Cap 80.06 2.314 12.00 103,309.632 15.00 98,207.824 5 Months in first year 42.000 Year Life (08/2066) Table I - Proved Composite Reserve Estimates and Economic Forecasts Ardmore Basin Acquisition Interests Stephens County, Oklahoma Proved Reserves As of July 31, 2024 THESE DATA ARE PART OF A CG&A REPORT AND ARE SUBJECT TO THE CONDITIONS IN THE TEXT OF THE REPORT. TEXAS REGISTERED ENGINEERING FIRM F - 693. 08/09/2024 15:46:26 Summary Cawley, Gillespie & Associates, Inc.
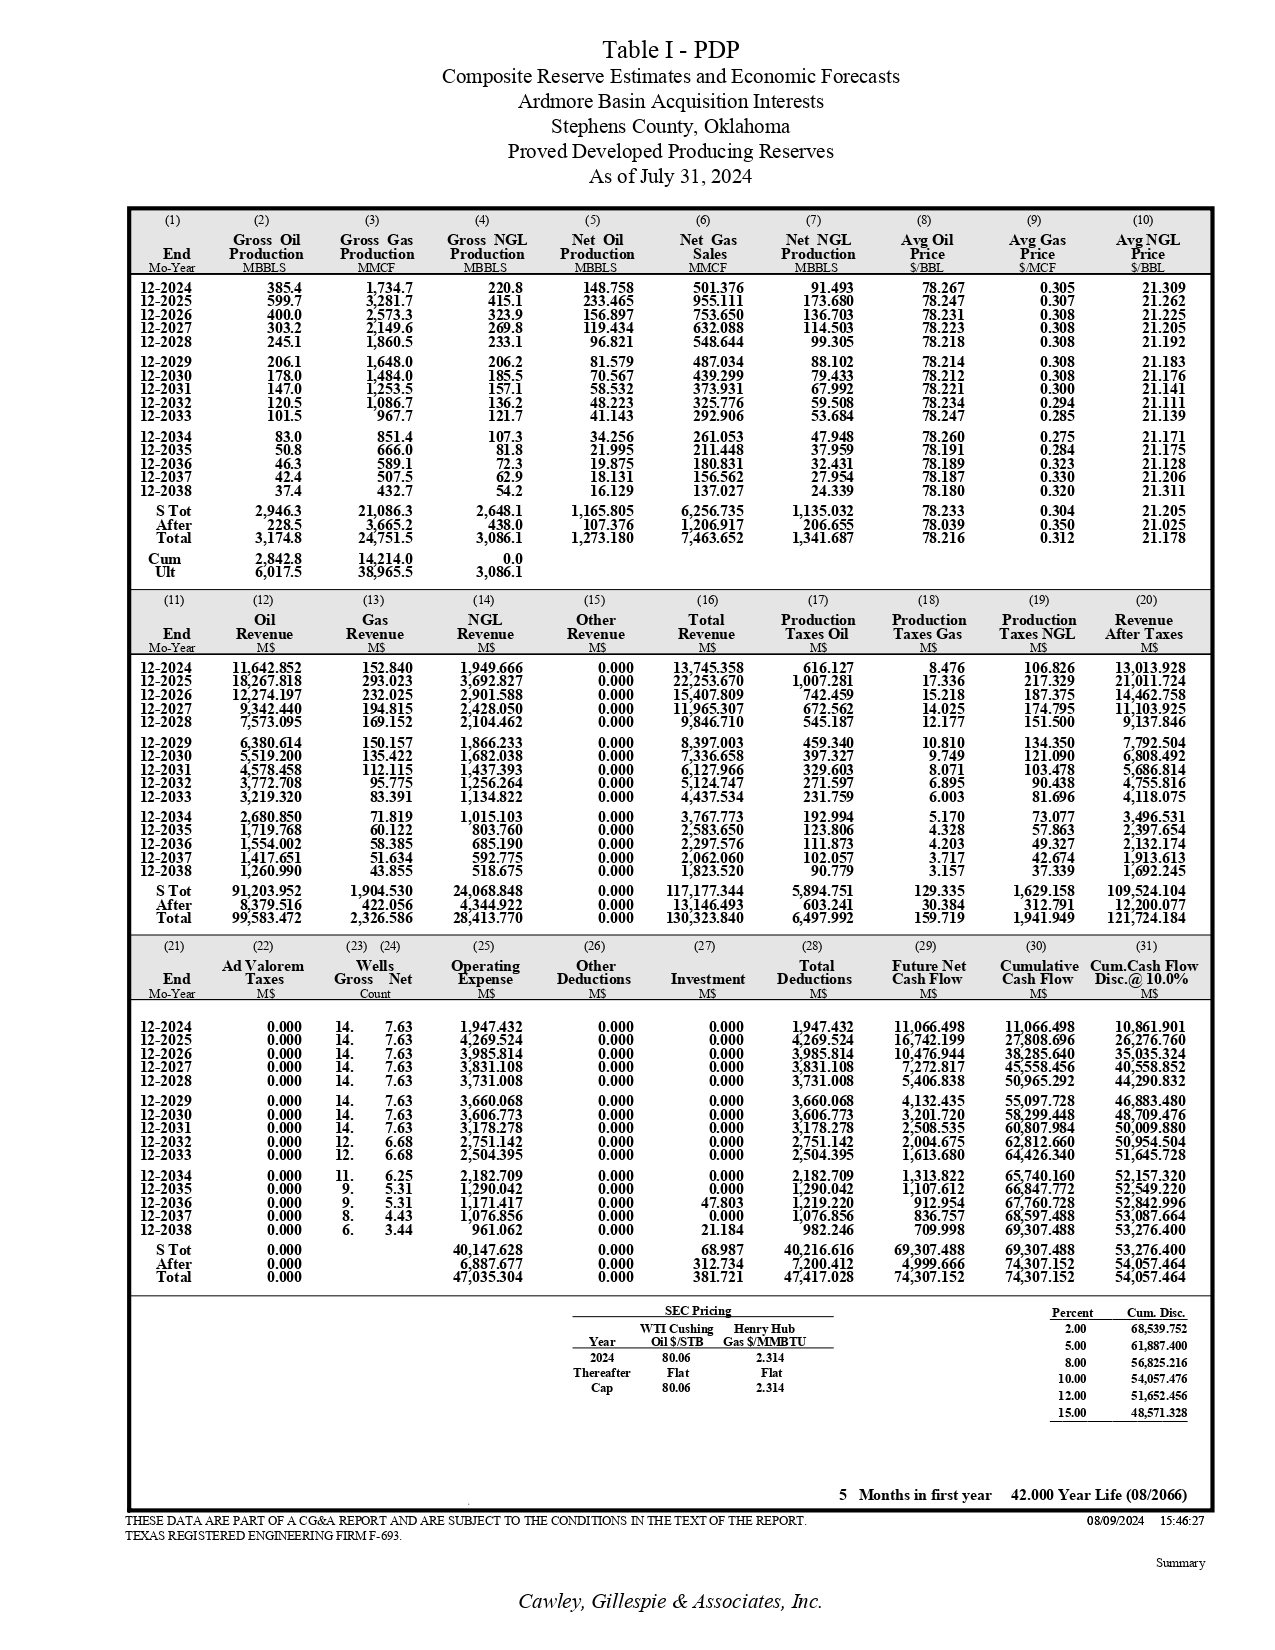
(9) (10) Av g Gas Av g NGL Price Price $/MCF $/BBL (8) Av g Oil Price $/BBL (5) (6) (7) Net Oil Net Gas Net NGL Production Sale s Production MBBLS MMCF MBBLS (4) Gross NGL Production MBBLS (3) Gross Gas Production MMCF (2) Gross Oil Production MBBLS (1) End Mo - Year 0.305 21.309 0.307 21.262 0.308 21.225 0.308 21.205 0.308 21.192 0.308 21.183 0.308 21.176 0.300 21.141 0.294 21.111 0.285 21.139 0.275 21.171 0.284 21.175 0.323 21.128 0.330 21.206 0.320 21.311 0.304 21.205 0.350 21.025 0.312 21.178 78.267 78.247 78.231 78.223 78.218 78.214 78.212 78.221 78.234 78.247 78.260 78.191 78.189 78.187 78.180 78.233 78.039 78.216 148.758 501.376 91.493 233.465 955.111 173.680 156.897 753.650 136.703 119.434 632.088 114.503 96.821 548.644 99.305 81.579 487.034 88.102 70.567 439.299 79.433 58.532 373.931 67.992 48.223 325.776 59.508 41.143 292.906 53.684 34.256 261.053 47.948 21.995 211.448 37.959 19.875 180.831 32.431 18.131 156.562 27.954 16.129 137.027 24.339 1,165.805 6,256.735 1,135.032 107.376 1,206.917 206.655 1,273.180 7,463.652 1,341.687 220.8 415.1 323.9 269.8 233.1 206.2 185.5 157.1 136.2 121.7 107.3 81.8 72.3 62.9 54.2 2,648.1 438.0 3,086.1 0.0 3,086.1 1,734.7 3,281.7 2,573.3 2,149.6 1,860.5 1,648.0 1,484.0 1,253.5 1,086.7 967.7 851.4 666.0 589.1 507.5 432.7 21,086.3 3,665.2 24,751.5 14,214.0 38,965.5 385.4 599.7 400.0 303.2 245.1 206.1 178.0 147.0 120.5 101.5 83.0 50.8 46.3 42.4 37.4 2,946.3 228.5 3,174.8 2,842.8 6,017.5 12 - 2024 12 - 2025 12 - 2026 12 - 2027 12 - 2028 12 - 2029 12 - 2030 12 - 2031 12 - 2032 12 - 2033 12 - 2034 12 - 2035 12 - 2036 12 - 2037 12 - 2038 S Tot After Total Cum Ult (19) (20) (18) (15) (16) (17) Other Total Production Revenue Revenue Taxes Oil M$ M$ M$ (14) (13) (12) (11) Production Revenue Taxes NG L Afte r Taxes M$ M$ Production Taxes Gas M$ NGL Revenue M$ Gas Revenue M$ Oil Revenue M$ End Mo - Year 106.826 13,013.928 217.329 21,011.724 187.375 14,462.758 174.795 11,103.925 151.500 9,137.846 134.350 7,792.504 121.090 6,808.492 103.478 5,686.814 90.438 4,755.816 81.696 4,118.075 73.077 3,496.531 57.863 2,397.654 49.327 2,132.174 42.674 1,913.613 37.339 1,692.245 1,629.158 109,524.104 312.791 12,200.077 1,941.949 121,724.184 8.476 17.336 15.218 14.025 12.177 10.810 9.749 8.071 6.895 6.003 5.170 4.328 4.203 3.717 3.157 129.335 30.384 159.719 0.000 13,745.358 616.127 0.000 22,253.670 1,007.281 0.000 15,407.809 742.459 0.000 11,965.307 672.562 0.000 9,846.710 545.187 0.000 8,397.003 459.340 0.000 7,336.658 397.327 0.000 6,127.966 329.603 0.000 5,124.747 271.597 0.000 4,437.534 231.759 0.000 3,767.773 192.994 0.000 2,583.650 123.806 0.000 2,297.576 111.873 0.000 2,062.060 102.057 0.000 1,823.520 90.779 0.000 117,177.344 5,894.751 0.000 13,146.493 603.241 0.000 130,323.840 6,497.992 1,949.666 3,692.827 2,901.588 2,428.050 2,104.462 1,866.233 1,682.038 1,437.393 1,256.264 1,134.822 1,015.103 803.760 685.190 592.775 518.675 24,068.848 4,344.922 28,413.770 152.840 293.023 232.025 194.815 169.152 150.157 135.422 112.115 95.775 83.391 71.819 60.122 58.385 51.634 43.855 1,904.530 422.056 2,326.586 11,642.852 18,267.818 12,274.197 9,342.440 7,573.095 6,380.614 5,519.200 4,578.458 3,772.708 3,219.320 2,680.850 1,719.768 1,554.002 1,417.651 1,260.990 91,203.952 8,379.516 99,583.472 12 - 2024 12 - 2025 12 - 2026 12 - 2027 12 - 2028 12 - 2029 12 - 2030 12 - 2031 12 - 2032 12 - 2033 12 - 2034 12 - 2035 12 - 2036 12 - 2037 12 - 2038 S Tot After Total (30) (31) (29) (26) (27) (28) (25) (23) (24) (22) (21) Cumulative Cum.Cash Flow Cash Flow Disc.@ 10.0% M$ M$ Future Net Cas h Flow M$ Other Total Deductions Investment Deductions M$ M$ M$ Operating Expense M$ Wells Gross Net Count A d Valorem Taxes M$ End Mo - Year 11,066.498 10,861.901 27,808.696 26,276.760 38,285.640 35,035.324 45,558.456 40,558.852 50,965.292 44,290.832 55,097.728 46,883.480 58,299.448 48,709.476 60,807.984 50,009.880 62,812.660 50,954.504 64,426.340 51,645.728 65,740.160 52,157.320 66,847.772 52,549.220 67,760.728 52,842.996 68,597.488 53,087.664 69,307.488 53,276.400 69,307.488 53,276.400 74,307.152 54,057.464 74,307.152 54,057.464 11,066.498 16,742.199 10,476.944 7,272.817 5,406.838 4,132.435 3,201.720 2,508.535 2,004.675 1,613.680 1,313.822 1,107.612 912.954 836.757 709.998 69,307.488 4,999.666 74,307.152 0.000 0.000 1,947.432 0.000 0.000 4,269.524 0.000 0.000 3,985.814 0.000 0.000 3,831.108 0.000 0.000 3,731.008 0.000 0.000 3,660.068 0.000 0.000 3,606.773 0.000 0.000 3,178.278 0.000 0.000 2,751.142 0.000 0.000 2,504.395 0.000 0.000 2,182.709 0.000 0.000 1,290.042 0.000 47.803 1,219.220 0.000 0.000 1,076.856 0.000 21.184 982.246 0.000 68.987 40,216.616 0.000 312.734 7,200.412 0.000 381.721 47,417.028 1,947.432 4,269.524 3,985.814 3,831.108 3,731.008 3,660.068 3,606.773 3,178.278 2,751.142 2,504.395 2,182.709 1,290.042 1,171.417 1,076.856 961.062 40,147.628 6,887.677 47,035.304 14. 7.63 14. 7.63 14. 7.63 14. 7.63 14. 7.63 14. 7.63 14. 7.63 14. 7.63 12. 6.68 12. 6.68 11. 6.25 9. 5.31 9. 5.31 8. 4.43 6. 3.44 0.000 0.000 0.000 0.000 0.000 0.000 0.000 0.000 0.000 0.000 0.000 0.000 0.000 0.000 0.000 0.000 0.000 0.000 12 - 2024 12 - 2025 12 - 2026 12 - 2027 12 - 2028 12 - 2029 12 - 2030 12 - 2031 12 - 2032 12 - 2033 12 - 2034 12 - 2035 12 - 2036 12 - 2037 12 - 2038 S Tot After Total Percent Cum . Disc. SE C Pricing WTI Cushing Henry Hub Yea r Oil $/STB Gas $/MMBTU 2024 80.06 2.314 Thereafter Flat Flat Cap 80.06 2.314 5 2.00 68,539.752 5.00 61,887.400 8.00 56,825.216 10.00 54,057.476 12.00 51,652.456 15.00 48,571.328 42.000 Year Life (08/2066) Months in first year Table I - PDP Composite Reserve Estimates and Economic Forecasts Ardmore Basin Acquisition Interests Stephens County, Oklahoma Proved Developed Producing Reserves As of July 31, 2024 THESE DATA ARE PART OF A CG&A REPORT AND ARE SUBJECT TO THE CONDITIONS IN THE TEXT OF THE REPORT. TEXAS REGISTERED ENGINEERING FIRM F - 693. 08/09/2024 15:46:27 Summary Cawley, Gillespie & Associates, Inc.
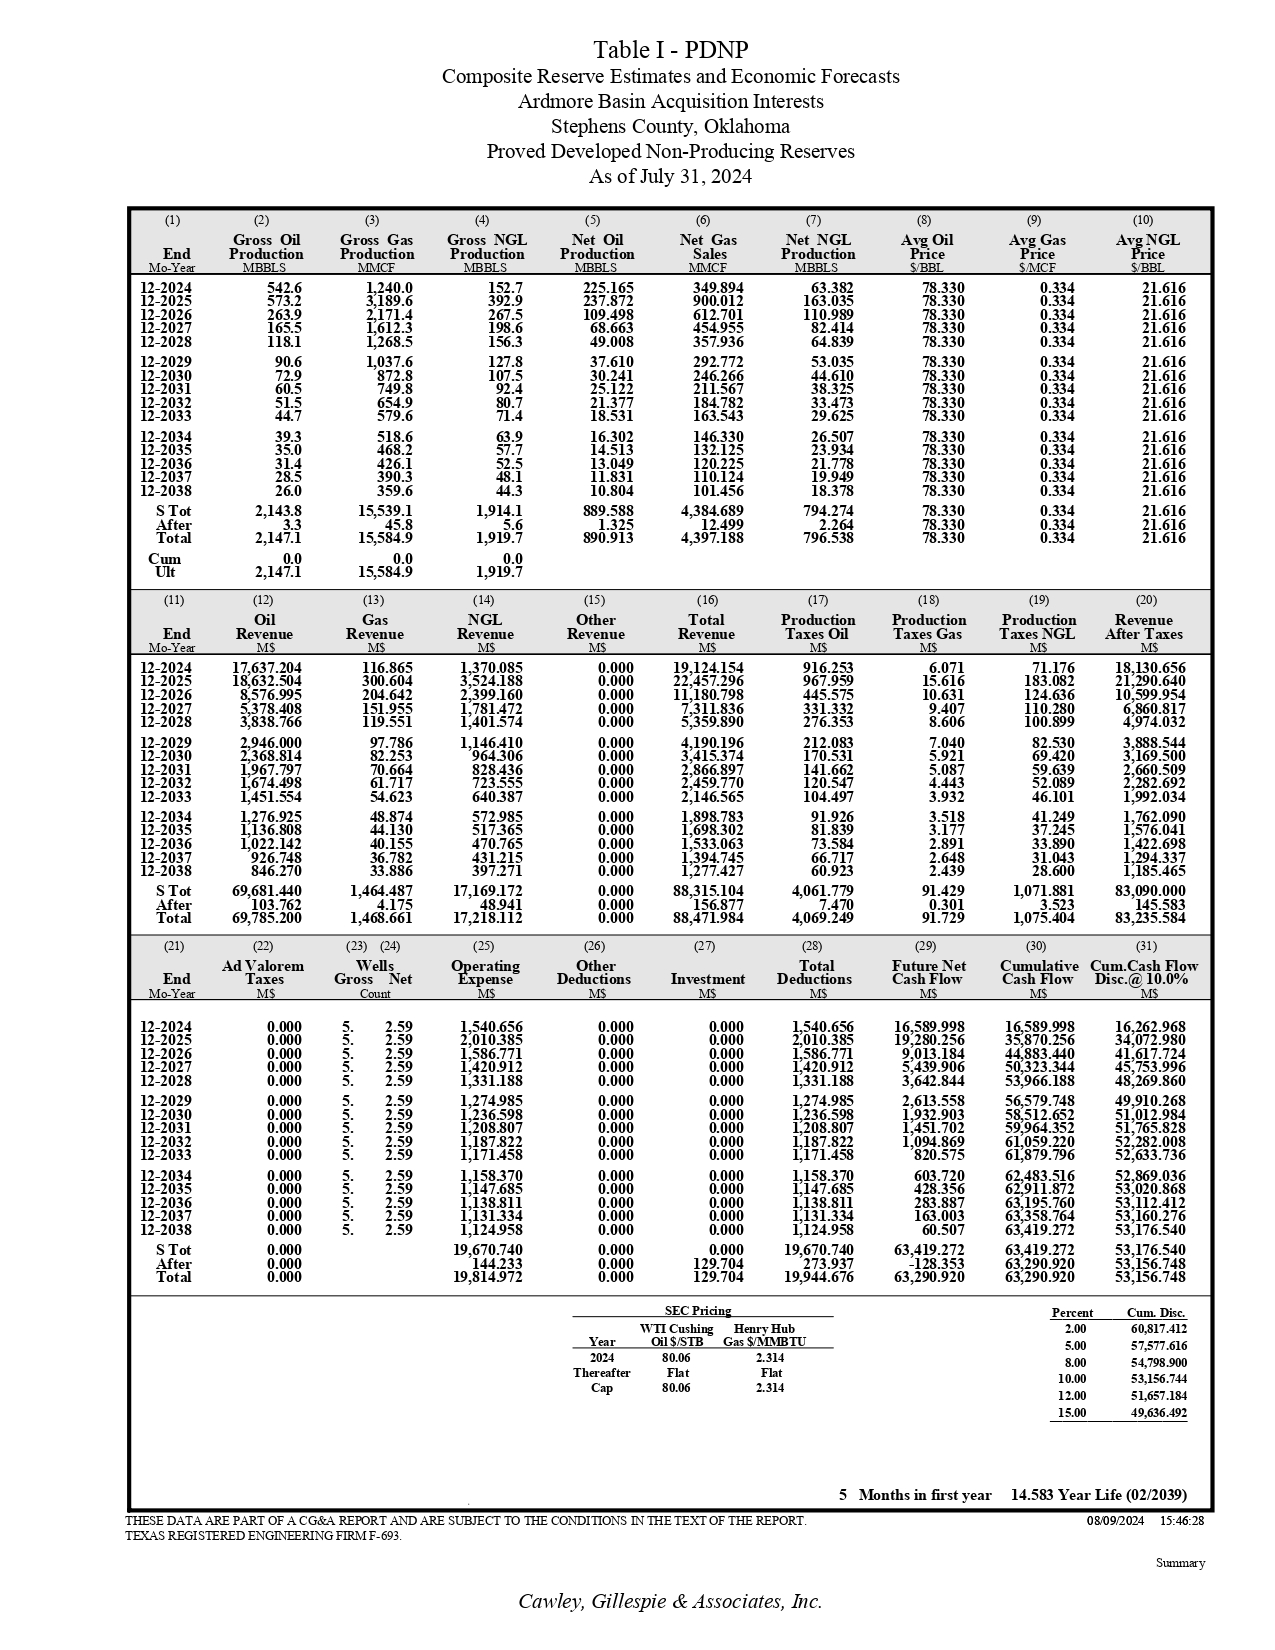
(9) (10) Av g Gas Av g NGL Price Price $/MCF $/BBL (8) Av g Oil Price $/BBL (5) (6) (7) Net Oil Net Gas Net NGL Production Sale s Production MBBLS MMCF MBBLS (4) Gross NGL Production MBBLS (3) Gross Gas Production MMCF (2) Gross Oil Production MBBLS (1) End Mo - Year 0.334 21.616 0.334 21.616 0.334 21.616 0.334 21.616 0.334 21.616 0.334 21.616 0.334 21.616 0.334 21.616 0.334 21.616 0.334 21.616 0.334 21.616 0.334 21.616 0.334 21.616 0.334 21.616 0.334 21.616 0.334 21.616 0.334 21.616 0.334 21.616 78.330 78.330 78.330 78.330 78.330 78.330 78.330 78.330 78.330 78.330 78.330 78.330 78.330 78.330 78.330 78.330 78.330 78.330 225.165 349.894 63.382 237.872 900.012 163.035 109.498 612.701 110.989 68.663 454.955 82.414 49.008 357.936 64.839 37.610 292.772 53.035 30.241 246.266 44.610 25.122 211.567 38.325 21.377 184.782 33.473 18.531 163.543 29.625 16.302 146.330 26.507 14.513 132.125 23.934 13.049 120.225 21.778 11.831 110.124 19.949 10.804 101.456 18.378 889.588 4,384.689 794.274 1.325 12.499 2.264 890.913 4,397.188 796.538 152.7 392.9 267.5 198.6 156.3 127.8 107.5 92.4 80.7 71.4 63.9 57.7 52.5 48.1 44.3 1,914.1 5.6 1,919.7 0.0 1,919.7 1,240.0 3,189.6 2,171.4 1,612.3 1,268.5 1,037.6 872.8 749.8 654.9 579.6 518.6 468.2 426.1 390.3 359.6 15,539.1 45.8 15,584.9 0.0 15,584.9 542.6 573.2 263.9 165.5 118.1 90.6 72.9 60.5 51.5 44.7 39.3 35.0 31.4 28.5 26.0 2,143.8 3.3 2,147.1 0.0 2,147.1 12 - 2024 12 - 2025 12 - 2026 12 - 2027 12 - 2028 12 - 2029 12 - 2030 12 - 2031 12 - 2032 12 - 2033 12 - 2034 12 - 2035 12 - 2036 12 - 2037 12 - 2038 S Tot After Total Cum Ult (19) (20) (18) (15) (16) (17) Other Total Production Revenue Revenue Taxes Oil M$ M$ M$ (14) (13) (12) (11) Production Revenue Taxes NG L Afte r Taxes M$ M$ Production Taxes Gas M$ NGL Revenue M$ Gas Revenue M$ Oil Revenue M$ End Mo - Year 71.176 18,130.656 183.082 21,290.640 124.636 10,599.954 110.280 6,860.817 100.899 4,974.032 82.530 3,888.544 69.420 3,169.500 59.639 2,660.509 52.089 2,282.692 46.101 1,992.034 41.249 1,762.090 37.245 1,576.041 33.890 1,422.698 31.043 1,294.337 28.600 1,185.465 1,071.881 83,090.000 3.523 145.583 1,075.404 83,235.584 6.071 15.616 10.631 9.407 8.606 7.040 5.921 5.087 4.443 3.932 3.518 3.177 2.891 2.648 2.439 91.429 0.301 91.729 0.000 19,124.154 916.253 0.000 22,457.296 967.959 0.000 11,180.798 445.575 0.000 7,311.836 331.332 0.000 5,359.890 276.353 0.000 4,190.196 212.083 0.000 3,415.374 170.531 0.000 2,866.897 141.662 0.000 2,459.770 120.547 0.000 2,146.565 104.497 0.000 1,898.783 91.926 0.000 1,698.302 81.839 0.000 1,533.063 73.584 0.000 1,394.745 66.717 0.000 1,277.427 60.923 0.000 88,315.104 4,061.779 0.000 156.877 7.470 0.000 88,471.984 4,069.249 1,370.085 3,524.188 2,399.160 1,781.472 1,401.574 1,146.410 964.306 828.436 723.555 640.387 572.985 517.365 470.765 431.215 397.271 17,169.172 48.941 17,218.112 116.865 300.604 204.642 151.955 119.551 97.786 82.253 70.664 61.717 54.623 48.874 44.130 40.155 36.782 33.886 1,464.487 4.175 1,468.661 17,637.204 18,632.504 8,576.995 5,378.408 3,838.766 2,946.000 2,368.814 1,967.797 1,674.498 1,451.554 1,276.925 1,136.808 1,022.142 926.748 846.270 69,681.440 103.762 69,785.200 12 - 2024 12 - 2025 12 - 2026 12 - 2027 12 - 2028 12 - 2029 12 - 2030 12 - 2031 12 - 2032 12 - 2033 12 - 2034 12 - 2035 12 - 2036 12 - 2037 12 - 2038 S Tot After Total (30) (31) (29) (26) (27) (28) (25) (23) (24) (22) (21) Cumulative Cum.Cash Flow Cash Flow Disc.@ 10.0% M$ M$ Future Net Cas h Flow M$ Other Total Deductions Investment Deductions M$ M$ M$ Operating Expense M$ Wells Gross Net Count A d Valorem Taxes M$ End Mo - Year 16,589.998 16,262.968 35,870.256 34,072.980 44,883.440 41,617.724 50,323.344 45,753.996 53,966.188 48,269.860 56,579.748 49,910.268 58,512.652 51,012.984 59,964.352 51,765.828 61,059.220 52,282.008 61,879.796 52,633.736 62,483.516 52,869.036 62,911.872 53,020.868 63,195.760 53,112.412 63,358.764 53,160.276 63,419.272 53,176.540 63,419.272 53,176.540 63,290.920 53,156.748 63,290.920 53,156.748 16,589.998 19,280.256 9,013.184 5,439.906 3,642.844 2,613.558 1,932.903 1,451.702 1,094.869 820.575 603.720 428.356 283.887 163.003 60.507 63,419.272 - 128.353 63,290.920 0.000 0.000 1,540.656 0.000 0.000 2,010.385 0.000 0.000 1,586.771 0.000 0.000 1,420.912 0.000 0.000 1,331.188 0.000 0.000 1,274.985 0.000 0.000 1,236.598 0.000 0.000 1,208.807 0.000 0.000 1,187.822 0.000 0.000 1,171.458 0.000 0.000 1,158.370 0.000 0.000 1,147.685 0.000 0.000 1,138.811 0.000 0.000 1,131.334 0.000 0.000 1,124.958 0.000 0.000 19,670.740 0.000 129.704 273.937 0.000 129.704 19,944.676 1,540.656 2,010.385 1,586.771 1,420.912 1,331.188 1,274.985 1,236.598 1,208.807 1,187.822 1,171.458 1,158.370 1,147.685 1,138.811 1,131.334 1,124.958 19,670.740 144.233 19,814.972 5. 2.59 5. 2.59 5. 2.59 5. 2.59 5. 2.59 5. 2.59 5. 2.59 5. 2.59 5. 2.59 5. 2.59 5. 2.59 5. 2.59 5. 2.59 5. 2.59 5. 2.59 0.000 0.000 0.000 0.000 0.000 0.000 0.000 0.000 0.000 0.000 0.000 0.000 0.000 0.000 0.000 0.000 0.000 0.000 12 - 2024 12 - 2025 12 - 2026 12 - 2027 12 - 2028 12 - 2029 12 - 2030 12 - 2031 12 - 2032 12 - 2033 12 - 2034 12 - 2035 12 - 2036 12 - 2037 12 - 2038 S Tot After Total Percent Cum . Disc. SE C Pricing WTI Cushing Henry Hub Yea r Oil $/STB Gas $/MMBTU 2024 80.06 2.314 Thereafter Flat Flat Cap 80.06 2.314 5 2.00 60,817.412 5.00 57,577.616 8.00 54,798.900 10.00 53,156.744 12.00 51,657.184 15.00 49,636.492 14.583 Year Life (02/2039) Months in first year Table I - PDNP Composite Reserve Estimates and Economic Forecasts Ardmore Basin Acquisition Interests Stephens County, Oklahoma Proved Developed Non - Producing Reserves As of July 31, 2024 THESE DATA ARE PART OF A CG&A REPORT AND ARE SUBJECT TO THE CONDITIONS IN THE TEXT OF THE REPORT. TEXAS REGISTERED ENGINEERING FIRM F - 693. 08/09/2024 15:46:28 Summary Cawley, Gillespie & Associates, Inc.
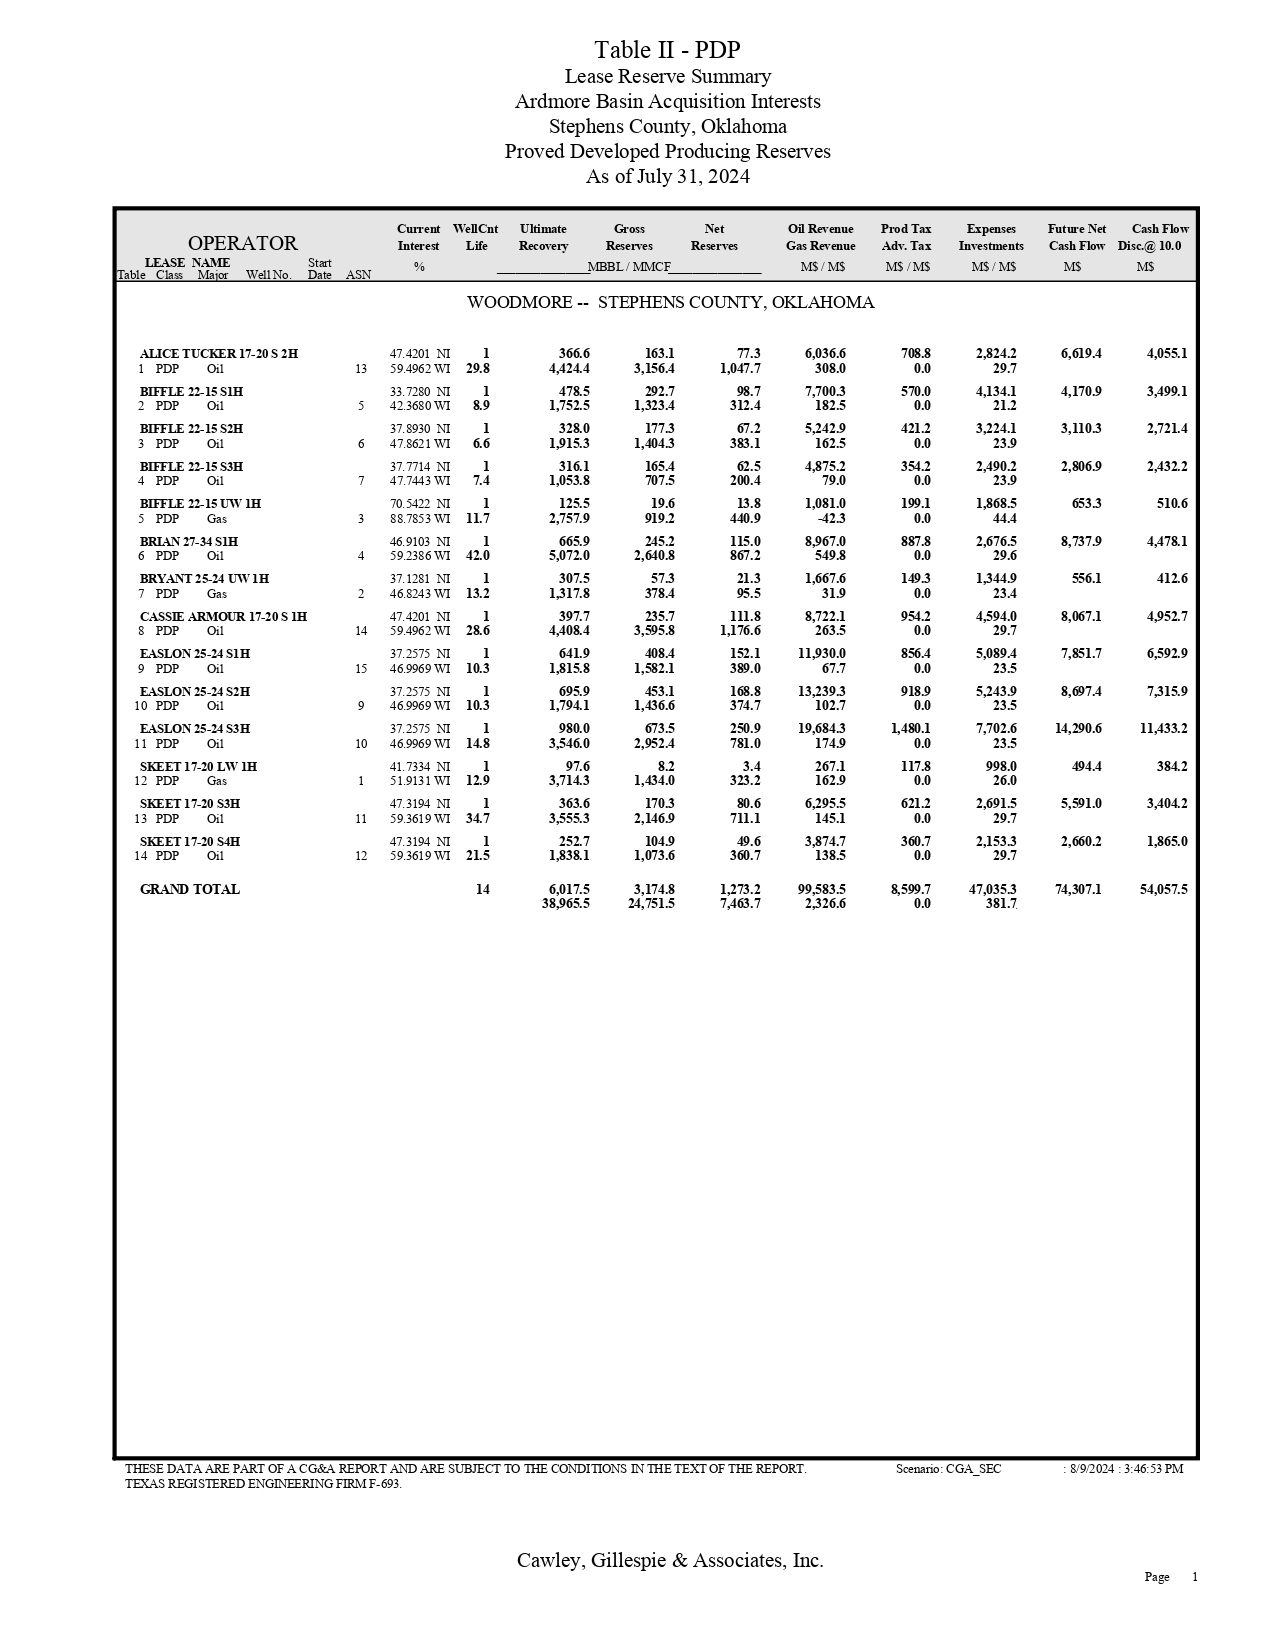
Cawley, Gillespie & Associates, Inc. Pag e 1 Table II - PDP Lease Reserve Summary Ardmore Basin Acquisition Interests Stephens County, Oklahoma Proved Developed Producing Reserves As of July 31, 2024 THESE DATA ARE PART OF A CG&A REPORT AND ARE SUBJECT TO THE CONDITIONS IN THE TEXT OF THE REPORT. TEXAS REGISTERED ENGINEERING FIRM F - 693. : 8/9/2024 : 3:46:53 PM Scenario : CGA_SEC Cas h Flow Disc.@ 10.0 M$ Future Net Cas h Flow M$ Expenses Investments M $ / M$ Prod Tax Adv . Tax M $ / M$ Oil Revenue Gas Revenue M $ / M$ Ultimate Gross Net Recover y Reserve s Reserves MBBL / MMCF WellCnt Life Current Interest % ASN Start Date ATOR Well No. OPER NAME Major LEASE Table Class STEPHENS COUNTY, OKLAHOMA WOODMORE -- 4,055.1 6,619.4 2,824.2 708.8 6,036.6 77.3 163.1 366.6 1 NI 47.4201 ALICE TUCKER 17 - 20 S 2H 29.7 0.0 308.0 1,047.7 3,156.4 4,424.4 29.8 59.4962 WI 13 Oil PDP 1 3,499.1 4,170.9 4,134.1 570.0 7,700.3 98.7 292.7 478.5 1 NI 33.7280 BIFFLE 22 - 15 S1H 21.2 0.0 182.5 312.4 1,323.4 1,752.5 8.9 42.3680 WI 5 Oil PDP 2 2,721.4 3,110.3 3,224.1 421.2 5,242.9 67.2 177.3 328.0 1 NI 37.8930 BIFFLE 22 - 15 S2H 23.9 0.0 162.5 383.1 1,404.3 1,915.3 6.6 47.8621 WI 6 Oil PDP 3 2,432.2 2,806.9 2,490.2 354.2 4,875.2 62.5 165.4 316.1 1 NI 37.7714 BIFFLE 22 - 15 S3H 23.9 0.0 79.0 200.4 707.5 1,053.8 7.4 47.7443 WI 7 Oil PDP 4 510.6 653.3 1,868.5 199.1 1,081.0 13.8 19.6 125.5 1 NI 70.5422 BIFFLE 22 - 15 UW 1H 44.4 0.0 - 42.3 440.9 919.2 2,757.9 11.7 88.7853 WI 3 Gas PDP 5 4,478.1 8,737.9 2,676.5 887.8 8,967.0 115.0 245.2 665.9 1 NI 46.9103 BRIAN 27 - 34 S1H 29.6 0.0 549.8 867.2 2,640.8 5,072.0 42.0 59.2386 WI 4 Oil PDP 6 412.6 556.1 1,344.9 149.3 1,667.6 21.3 57.3 307.5 1 NI 37.1281 BRYANT 25 - 24 UW 1H 23.4 0.0 31.9 95.5 378.4 1,317.8 13.2 46.8243 WI 2 Gas PDP 7 4,952.7 8,067.1 4,594.0 954.2 8,722.1 111.8 235.7 397.7 1 NI 47.4201 CASSIE ARMOUR 17 - 20 S 1H 29.7 0.0 263.5 1,176.6 3,595.8 4,408.4 28.6 59.4962 WI 14 Oil PDP 8 6,592.9 7,851.7 5,089.4 856.4 11,930.0 152.1 408.4 641.9 1 NI 37.2575 EASLON 25 - 24 S1H 23.5 0.0 67.7 389.0 1,582.1 1,815.8 10.3 46.9969 WI 15 Oil PDP 9 7,315.9 8,697.4 5,243.9 918.9 13,239.3 168.8 453.1 695.9 1 NI 37.2575 EASLON 25 - 24 S2H 23.5 0.0 102.7 374.7 1,436.6 1,794.1 10.3 46.9969 WI 9 Oil PDP 10 11,433.2 14,290.6 7,702.6 1,480.1 19,684.3 250.9 673.5 980.0 1 NI 37.2575 EASLON 25 - 24 S3H 23.5 0.0 174.9 781.0 2,952.4 3,546.0 14.8 46.9969 WI 10 Oil PDP 11 384.2 494.4 998.0 117.8 267.1 3.4 8.2 97.6 1 NI 41.7334 SKEET 17 - 20 LW 1H 26.0 0.0 162.9 323.2 1,434.0 3,714.3 12.9 51.9131 WI 1 Gas PDP 12 3,404.2 5,591.0 2,691.5 621.2 6,295.5 80.6 170.3 363.6 1 NI 47.3194 SKEE T 17 - 20 S3H 29.7 0.0 145.1 711.1 2,146.9 3,555.3 34.7 59.3619 WI 11 Oil PDP 13 1,865.0 2,660.2 2,153.3 360.7 3,874.7 49.6 104.9 252.7 1 NI 47.3194 SKEE T 17 - 20 S4H 29.7 0.0 138.5 360.7 1,073.6 1,838.1 21.5 59.3619 WI 12 Oil PDP 14 54,057.5 74,307.1 47,035.3 8,599.7 99,583.5 1,273.2 3,174.8 6,017.5 14 GRAND TOTAL 381.7 0.0 2,326.6 7,463.7 24,751.5 38,965.5
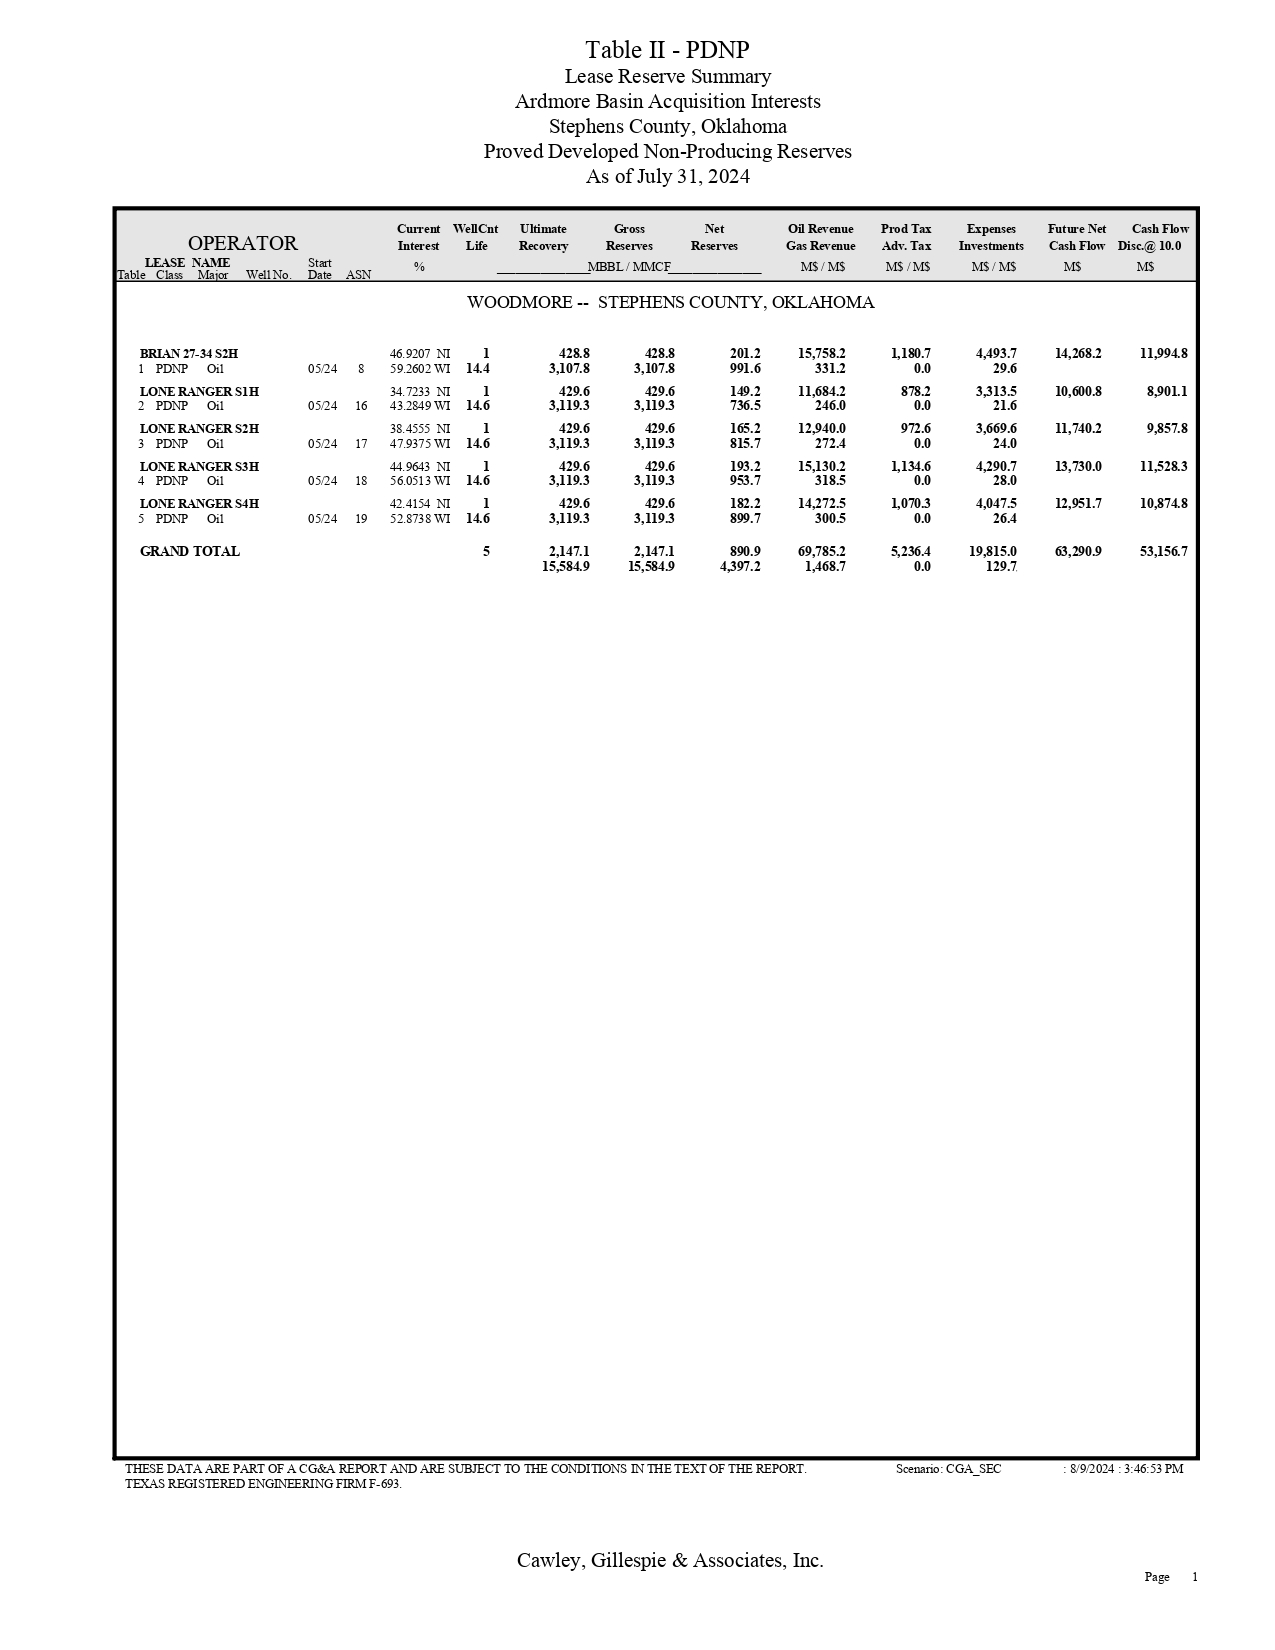
Cawley, Gillespie & Associates, Inc. Pag e 1 Table II - PDNP Lease Reserve Summary Ardmore Basin Acquisition Interests Stephens County, Oklahoma Proved Developed Non - Producing Reserves As of July 31, 2024 THESE DATA ARE PART OF A CG&A REPORT AND ARE SUBJECT TO THE CONDITIONS IN THE TEXT OF THE REPORT. TEXAS REGISTERED ENGINEERING FIRM F - 693. : 8/9/2024 : 3:46:53 PM Scenario : CGA_SEC Cas h Flow Disc.@ 10.0 M$ Future Net Cas h Flow M$ Expenses Investments M $ / M$ Prod Tax Adv . Tax M $ / M$ Oil Revenue Gas Revenue M $ / M$ Ultimate Gross Net Recover y Reserve s Reserves MBBL / MMCF WellCnt Life Current Interest % ASN Start Date ATOR Well No. OPER LEASE NAME Table Class Major STEPHENS COUNTY, OKLAHOMA WOODMORE -- 11,994.8 14,268.2 4,493.7 1,180.7 15,758.2 201.2 428.8 428.8 1 NI 46.9207 BRIAN 27 - 34 S2H 29.6 0.0 331.2 991.6 3,107.8 3,107.8 14.4 59.2602 WI 8 05/24 Oil PDNP 1 8,901.1 10,600.8 3,313.5 878.2 11,684.2 149.2 429.6 429.6 1 NI 34.7233 LONE RANGE R S1H 21.6 0.0 246.0 736.5 3,119.3 3,119.3 14.6 43.2849 WI 16 05/24 Oil PDNP 2 9,857.8 11,740.2 3,669.6 972.6 12,940.0 165.2 429.6 429.6 1 NI 38.4555 LONE RANGE R S2H 24.0 0.0 272.4 815.7 3,119.3 3,119.3 14.6 47.9375 WI 17 05/24 Oil PDNP 3 11,528.3 13,730.0 4,290.7 1,134.6 15,130.2 193.2 429.6 429.6 1 NI 44.9643 LONE RANGE R S3H 28.0 0.0 318.5 953.7 3,119.3 3,119.3 14.6 56.0513 WI 18 05/24 Oil PDNP 4 10,874.8 12,951.7 4,047.5 1,070.3 14,272.5 182.2 429.6 429.6 1 NI 42.4154 LONE RANGE R S4H 26.4 0.0 300.5 899.7 3,119.3 3,119.3 14.6 52.8738 WI 19 05/24 Oil PDNP 5 53,156.7 63,290.9 19,815.0 5,236.4 69,785.2 890.9 2,147.1 2,147.1 5 GRAND TOTAL 129.7 0.0 1,468.7 4,397.2 15,584.9 15,584.9
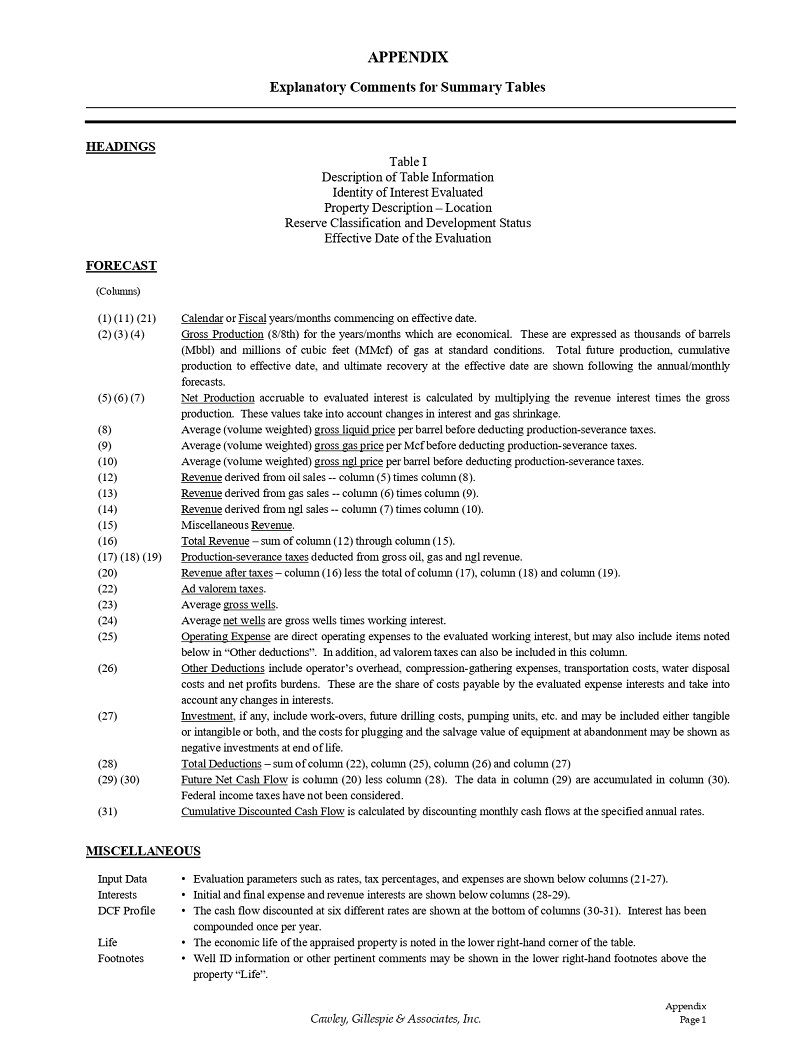
APPENDIX Explanatory Comments for Summary Tables HEADINGS Appendix P a g e 1 Cawley, Gillespie & Associates, Inc. Tab l e I Description of Table Information Identity of Interest Evaluated Property Description – Location Reserve Classification and Development Status Effective Date of the Evaluation FORECAST (Columns) ( 1 ) ( 11 ) ( 21 ) ( 2 ) ( 3 ) ( 4 ) Calendar or Fiscal years/months commencing on effective date . Gross Production ( 8 / 8 th) for the years/months which are economical . These are expressed as thousands of barrels (Mbbl) and millions of cubic feet (MMcf) of gas at standard conditions . Total future production, cumulative production to effective date, and ultimate recovery at the effective date are shown following the annual/monthly forecasts . Net Production accruable to evaluated interest is calculated by multiplying the revenue interest times the gross production. These values take into account changes in interest and gas shrinkage. Average (volume weighted) gross liquid price per barrel before deducting production - severance taxes. Average (volume weighted) gross gas price per Mcf before deducting production - severance taxes. Average (volume weighted) gross ngl price per barrel before deducting production - severance taxes. Revenue derived from oil sales -- column (5) times column (8). Revenue derived from gas sales -- column (6) times column (9). Revenue derived from ngl sales -- column (7) times column (10). Miscellaneous Revenue . Total Revenue – sum of column (12) through column (15). Production - severance taxes deducted from gross oil, gas and ngl revenue. Revenue after taxes – column (16) less the total of column (17), column (18) and column (19). Ad valorem taxes . A v e r a g e g r o s s w e l l s . Average net wells are gross wells times working interest. Operating Expense are direct operating expenses to the evaluated working interest, but may also include items noted below in “Other deductions” . In addition, ad valorem taxes can also be included in this column . Other Deductions include operator’s overhead, compression - gathering expenses, transportation costs, water disposal costs and net profits burdens . These are the share of costs payable by the evaluated expense interests and take into account any changes in interests . Investment , if any, include work - overs, future drilling costs, pumping units, etc . and may be included either tangible or intangible or both, and the costs for plugging and the salvage value of equipment at abandonment may be shown as negative investments at end of life . Total Deductions – sum of column ( 22 ), column ( 25 ), column ( 26 ) and column ( 27 ) Future Net Cash Flow is column ( 20 ) less column ( 28 ) . The data in column ( 29 ) are accumulated in column ( 30 ) . Federal income taxes have not been considered . Cumulative Discounted Cash Flow is calculated by discounting monthly cash flows at the specified annual rates . ( 5 ) ( 6 ) ( 7 ) (8) (9) (10) (12) (13) (14) (15) (16) ( 17 ) ( 18 ) ( 19) (20) (22) (23) (24) (25) ( 26) ( 27) (28) ( 29 ) ( 30) ( 31) MISCELLANEOUS Input Data Interests DC F P r o fi l e • Evaluation parameters such as rates, tax percentages, and expenses are shown below columns (21 - 27). • Initial and final expense and revenue interests are shown below columns (28 - 29). • The cash flow discounted at six different rates are shown at the bottom of columns (30 - 31). Interest has been compounded once per year. • The economic life of the appraised property is noted in the lower right - hand corner of the table. • Well ID information or other pertinent comments may be shown in the lower right - hand footnotes above the property “Life”. Life Foo t no t e s
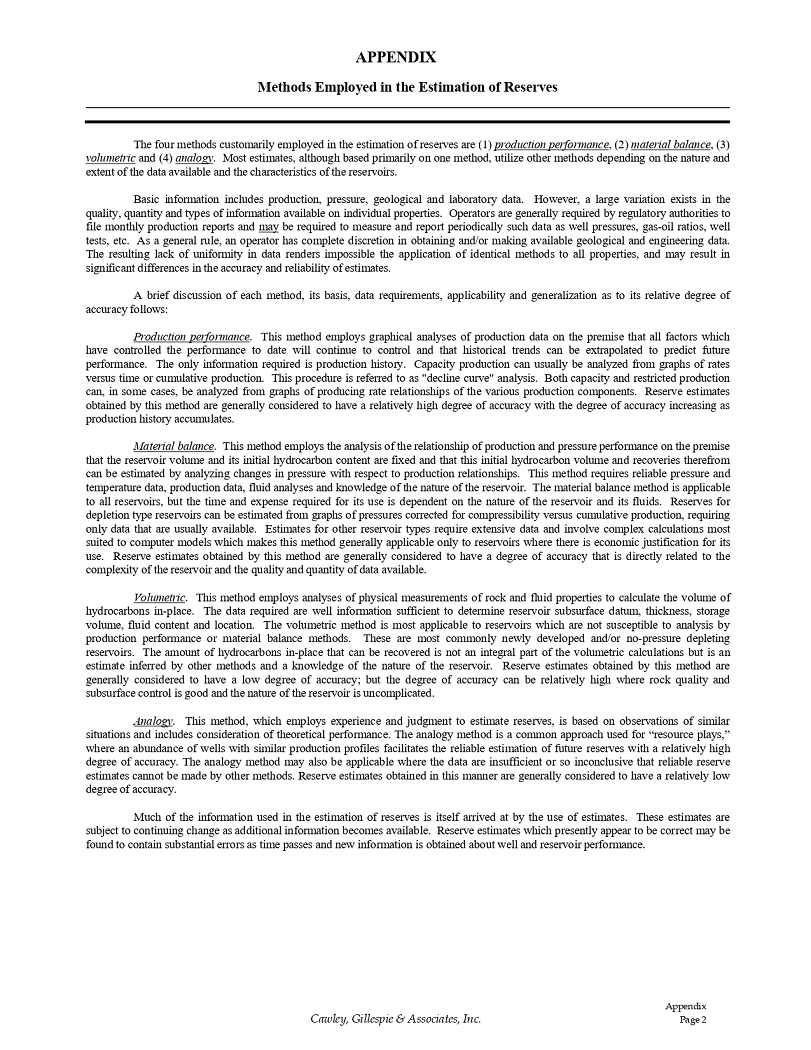
APPENDIX Methods Employed in the Estimation of Reserves The four methods customarily employed in the estimation of reserves are ( 1 ) production performance , ( 2 ) material balance , ( 3 ) volumetric and ( 4 ) analogy . Most estimates, although based primarily on one method, utilize other methods depending on the nature and extent of the data available and the characteristics of the reservoirs . Basic information includes production, pressure, geological and laboratory data . However, a large variation exists in the quality, quantity and types of information available on individual properties . Operators are generally required by regulatory authorities to file monthly production reports and may be required to measure and report periodically such data as well pressures, gas - oil ratios, well tests, etc . As a general rule, an operator has complete discretion in obtaining and/or making available geological and engineering data . The resulting lack of uniformity in data renders impossible the application of identical methods to all properties, and may result in significant differences in the accuracy and reliability of estimates . A brief discussion of each method, its basis, data requirements, applicability and generalization as to its relative degree of accuracy follows : Production performance . This method employs graphical analyses of production data on the premise that all factors which have controlled the performance to date will continue to control and that historical trends can be extrapolated to predict future performance . The only information required is production history . Capacity production can usually be analyzed from graphs of rates versus time or cumulative production . This procedure is referred to as "decline curve" analysis . Both capacity and restricted production can, in some cases, be analyzed from graphs of producing rate relationships of the various production components . Reserve estimates obtained by this method are generally considered to have a relatively high degree of accuracy with the degree of accuracy increasing as production history accumulates . Material balance . This method employs the analysis of the relationship of production and pressure performance on the premise that the reservoir volume and its initial hydrocarbon content are fixed and that this initial hydrocarbon volume and recoveries therefrom can be estimated by analyzing changes in pressure with respect to production relationships . This method requires reliable pressure and temperature data, production data, fluid analyses and knowledge of the nature of the reservoir . The material balance method is applicable to all reservoirs, but the time and expense required for its use is dependent on the nature of the reservoir and its fluids . Reserves for depletion type reservoirs can be estimated from graphs of pressures corrected for compressibility versus cumulative production, requiring only data that are usually available . Estimates for other reservoir types require extensive data and involve complex calculations most suited to computer models which makes this method generally applicable only to reservoirs where there is economic justification for its use . Reserve estimates obtained by this method are generally considered to have a degree of accuracy that is directly related to the complexity of the reservoir and the quality and quantity of data available . Volumetric . This method employs analyses of physical measurements of rock and fluid properties to calculate the volume of hydrocarbons in - place . The data required are well information sufficient to determine reservoir subsurface datum, thickness, storage volume, fluid content and location . The volumetric method is most applicable to reservoirs which are not susceptible to analysis by production performance or material balance methods . These are most commonly newly developed and/or no - pressure depleting reservoirs . The amount of hydrocarbons in - place that can be recovered is not an integral part of the volumetric calculations but is an estimate inferred by other methods and a knowledge of the nature of the reservoir . Reserve estimates obtained by this method are generally considered to have a low degree of accuracy ; but the degree of accuracy can be relatively high where rock quality and subsurface control is good and the nature of the reservoir is uncomplicated . Analogy . This method, which employs experience and judgment to estimate reserves, is based on observations of similar situations and includes consideration of theoretical performance . The analogy method is a common approach used for “resource plays,” where an abundance of wells with similar production profiles facilitates the reliable estimation of future reserves with a relatively high degree of accuracy . The analogy method may also be applicable where the data are insufficient or so inconclusive that reliable reserve estimates cannot be made by other methods . Reserve estimates obtained in this manner are generally considered to have a relatively low degree of accuracy . Much of the information used in the estimation of reserves is itself arrived at by the use of estimates . These estimates are subject to continuing change as additional information becomes available . Reserve estimates which presently appear to be correct may be found to contain substantial errors as time passes and new information is obtained about well and reservoir performance . Appendix P a g e 2 Cawley, Gillespie & Associates, Inc.
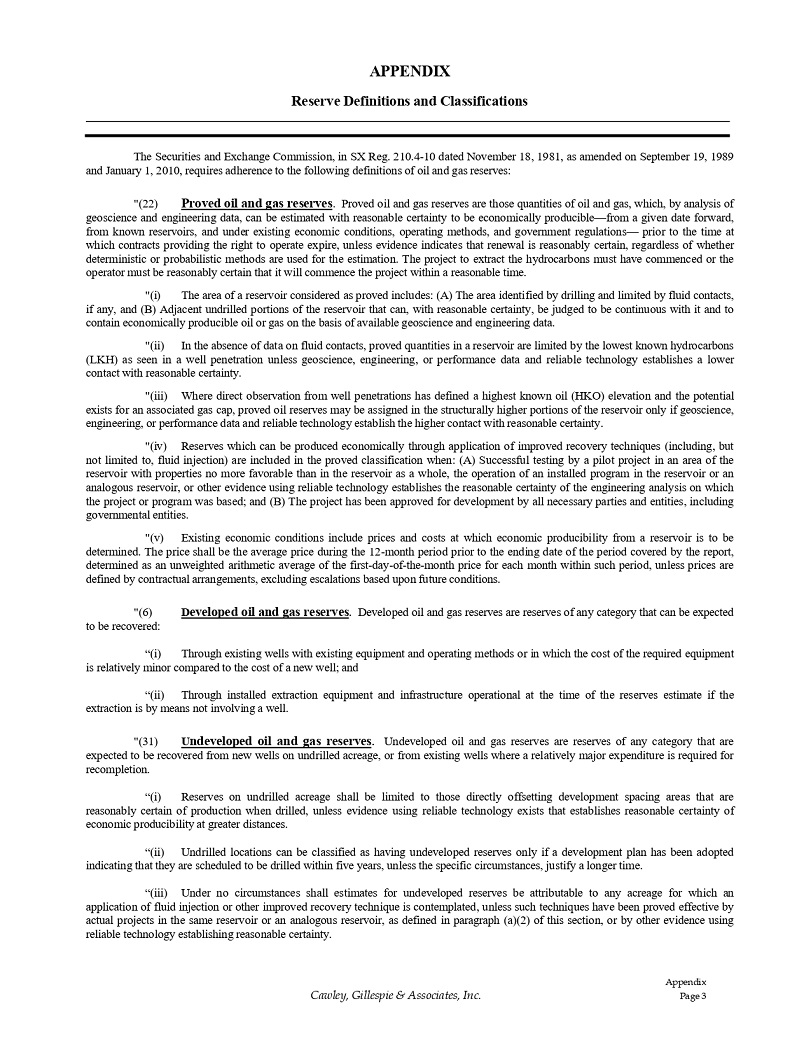
APPENDIX Reserve Definitions and Classifications The Securities and Exchange Commission, in SX Reg. 210.4 - 10 dated November 18, 1981, as amended on September 19, 1989 and January 1, 2010, requires adherence to the following definitions of oil and gas reserves: Appendix P a g e 3 Cawley, Gillespie & Associates, Inc. " ( 22) Proved oil and gas reserves . Proved oil and gas reserves are those quantities of oil and gas, which, by analysis of geoscience and engineering data, can be estimated with reasonable certainty to be economically producible — from a given date forward, from known reservoirs, and under existing economic conditions, operating methods, and government regulations — prior to the time at which contracts providing the right to operate expire, unless evidence indicates that renewal is reasonably certain, regardless of whether deterministic or probabilistic methods are used for the estimation . The project to extract the hydrocarbons must have commenced or the operator must be reasonably certain that it will commence the project within a reasonable time . "(i) The area of a reservoir considered as proved includes : (A) The area identified by drilling and limited by fluid contacts, if any, and (B) Adjacent undrilled portions of the reservoir that can, with reasonable certainty, be judged to be continuous with it and to contain economically producible oil or gas on the basis of available geoscience and engineering data . "(ii) In the absence of data on fluid contacts, proved quantities in a reservoir are limited by the lowest known hydrocarbons (LKH) as seen in a well penetration unless geoscience, engineering, or performance data and reliable technology establishes a lower contact with reasonable certainty . "(iii) Where direct observation from well penetrations has defined a highest known oil (HKO) elevation and the potential exists for an associated gas cap, proved oil reserves may be assigned in the structurally higher portions of the reservoir only if geoscience, engineering, or performance data and reliable technology establish the higher contact with reasonable certainty . "(iv) Reserves which can be produced economically through application of improved recovery techniques (including, but not limited to, fluid injection) are included in the proved classification when : (A) Successful testing by a pilot project in an area of the reservoir with properties no more favorable than in the reservoir as a whole, the operation of an installed program in the reservoir or an analogous reservoir, or other evidence using reliable technology establishes the reasonable certainty of the engineering analysis on which the project or program was based ; and (B) The project has been approved for development by all necessary parties and entities, including governmental entities . "(v) Existing economic conditions include prices and costs at which economic producibility from a reservoir is to be determined . The price shall be the average price during the 12 - month period prior to the ending date of the period covered by the report, determined as an unweighted arithmetic average of the first - day - of - the - month price for each month within such period, unless prices are defined by contractual arrangements, excluding escalations based upon future conditions . "(6) t o b e r ec ov e r e d : D eveloped oil and gas reserves . Developed oil and gas reserves are reserves of any category that can be expected “(i) Through existing wells with existing equipment and operating methods or in which the cost of the required equipment is relatively minor compared to the cost of a new well ; and “(ii) Through installed extraction equipment and infrastructure operational at the time of the reserves estimate if the extraction is by means not involving a well . "( 31 ) U ndeveloped oil and gas reserves . Undeveloped oil and gas reserves are reserves of any category that are expected to be recovered from new wells on undrilled acreage, or from existing wells where a relatively major expenditure is required for recompletion . “(i) Reserves on undrilled acreage shall be limited to those directly offsetting development spacing areas that are reasonably certain of production when drilled, unless evidence using reliable technology exists that establishes reasonable certainty of economic producibility at greater distances . “(ii) Undrilled locations can be classified as having undeveloped reserves only if a development plan has been adopted indicating that they are scheduled to be drilled within five years, unless the specific circumstances, justify a longer time . “(iii) Under no circumstances shall estimates for undeveloped reserves be attributable to any acreage for which an application of fluid injection or other improved recovery technique is contemplated, unless such techniques have been proved effective by actual projects in the same reservoir or an analogous reservoir, as defined in paragraph (a)( 2 ) of this section, or by other evidence using reliable technology establishing reasonable certainty .
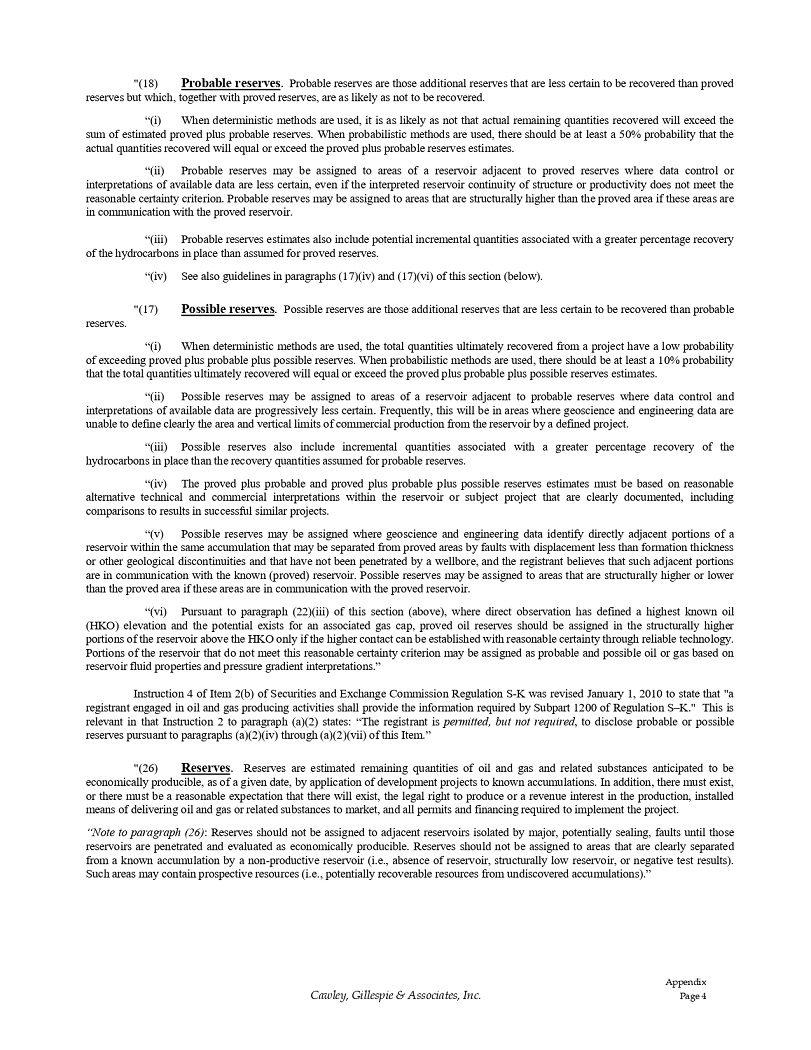
Appendix P a g e 4 Cawley, Gillespie & Associates, Inc. "(18) Probable reserves . Probable reserves are those additional reserves that are less certain to be recovered than proved reserves but which, together with proved reserves, are as likely as not to be recovered. “(i) When deterministic methods are used, it is as likely as not that actual remaining quantities recovered will exceed the sum of estimated proved plus probable reserves . When probabilistic methods are used, there should be at least a 50 % probability that the actual quantities recovered will equal or exceed the proved plus probable reserves estimates . “(ii) Probable reserves may be assigned to areas of a reservoir adjacent to proved reserves where data control or interpretations of available data are less certain, even if the interpreted reservoir continuity of structure or productivity does not meet the reasonable certainty criterion . Probable reserves may be assigned to areas that are structurally higher than the proved area if these areas are in communication with the proved reservoir . “(iii) Probable reserves estimates also include potential incremental quantities associated with a greater percentage recovery of the hydrocarbons in place than assumed for proved reserves . “(iv) See also guidelines in paragraphs (17)(iv) and (17)(vi) of this section (below). " ( 17) Possible reserves . Possible reserves are those additional reserves that are less certain to be recovered than probable reserves. “(i) When deterministic methods are used, the total quantities ultimately recovered from a project have a low probability of exceeding proved plus probable plus possible reserves . When probabilistic methods are used, there should be at least a 10 % probability that the total quantities ultimately recovered will equal or exceed the proved plus probable plus possible reserves estimates . “(ii) Possible reserves may be assigned to areas of a reservoir adjacent to probable reserves where data control and interpretations of available data are progressively less certain . Frequently, this will be in areas where geoscience and engineering data are unable to define clearly the area and vertical limits of commercial production from the reservoir by a defined project . “(iii) Possible reserves also include incremental quantities associated with a greater percentage recovery of the hydrocarbons in place than the recovery quantities assumed for probable reserves . “(iv) The proved plus probable and proved plus probable plus possible reserves estimates must be based on reasonable alternative technical and commercial interpretations within the reservoir or subject project that are clearly documented, including comparisons to results in successful similar projects . “(v) Possible reserves may be assigned where geoscience and engineering data identify directly adjacent portions of a reservoir within the same accumulation that may be separated from proved areas by faults with displacement less than formation thickness or other geological discontinuities and that have not been penetrated by a wellbore, and the registrant believes that such adjacent portions are in communication with the known (proved) reservoir . Possible reserves may be assigned to areas that are structurally higher or lower than the proved area if these areas are in communication with the proved reservoir . “(vi) Pursuant to paragraph ( 22 )(iii) of this section (above), where direct observation has defined a highest known oil (HKO) elevation and the potential exists for an associated gas cap, proved oil reserves should be assigned in the structurally higher portions of the reservoir above the HKO only if the higher contact can be established with reasonable certainty through reliable technology . Portions of the reservoir that do not meet this reasonable certainty criterion may be assigned as probable and possible oil or gas based on reservoir fluid properties and pressure gradient interpretations . ” Instruction 4 of Item 2 (b) of Securities and Exchange Commission Regulation S - K was revised January 1 , 2010 to state that "a registrant engaged in oil and gas producing activities shall provide the information required by Subpart 1200 of Regulation S – K . " This is relevant in that Instruction 2 to paragraph (a)( 2 ) states : “The registrant is permitted, but not required , to disclose probable or possible reserves pursuant to paragraphs (a)( 2 )(iv) through (a)( 2 )(vii) of this Item . ” "( 26 ) Reserves . Reserves are estimated remaining quantities of oil and gas and related substances anticipated to be economically producible, as of a given date, by application of development projects to known accumulations . In addition, there must exist, or there must be a reasonable expectation that there will exist, the legal right to produce or a revenue interest in the production, installed means of delivering oil and gas or related substances to market, and all permits and financing required to implement the project . “Note to paragraph ( 26 ) : Reserves should not be assigned to adjacent reservoirs isolated by major, potentially sealing, faults until those reservoirs are penetrated and evaluated as economically producible . Reserves should not be assigned to areas that are clearly separated from a known accumulation by a non - productive reservoir (i . e . , absence of reservoir, structurally low reservoir, or negative test results) . Such areas may contain prospective resources (i . e . , potentially recoverable resources from undiscovered accumulations) . ”