INVESTOR PRESENTATION, DATED SEPTEMBER 16, 2025
Published on September 17, 2025
Exhibit 99.2
NYSE: MNR machnr.com Mach: Stronger and Transformed Post San Juan and Permian Basin Closing September 16, 2025
Disclaimer and Forward - Looking Statements 2 FORWARD - LOOKING STATEMENTS This presentation contains statements that express the Company’s opinions, expectations, beliefs, plans, objectives, assumptions or projections regarding future events or future results, in contrast with statements that reflect historical facts. All statements, other than statements of historical fact included in this presentation regarding our strategy, future operations, financial position, estimated revenues and losses, projected costs, prospects, plans and objectives of management are forward - looking statements. When used in this presentation, words such as “may,” “assume,” “forecast,” “could,” “should,” “will,” “plan,” “believe,” “anticipate,” “intend,” “estimate,” “expect,” “project,” “budget” and similar expressions are used to identify forward - looking statements, although not all forward - looking statements contain such identifying words. Specific forward - looking statements include statements regarding the Company’s projected results of operating, financial position, growth opportunities and reserve estimates. These forward - looking statements are based on management’s current belief, based on currently available information as to the outcome and timing of future events at the time such statement was made. Such statements are subject to a number of assumptions, risk and uncertainties, many of which are beyond the control of the Company. These include, but are not limited to, the Company’s future financial condition, results of operations and ability to achieve the guidance provided, strategy and plans; the ability of the Company to realize anticipated synergies related to the closing of the Permian Basin and San Juan Basin transactions in the timeframe expected or at all; changes in markets and the ability of the Company to finance operations in the manner expected; commodity price volatility; the impact of epidemics, outbreaks or other public health events, and the related effects on financial markets, worldwide economic activity and our operations; uncertainties about our estimated oil, natural gas and natural gas liquids reserves, including the impact of commodity price declines on the economic producibility of such reserves, and in projecting future rates of production; the concentration of our operations in the Anadarko Basin; difficult and adverse conditions in the domestic and global capital and credit markets; lack of transportation and storage capacity as a result of oversupply, government regulations or other factors; lack of availability of drilling and production equipment and services; potential financial losses or earnings reductions resulting from our commodity price risk management program or any inability to manage our commodity risks; failure to realize expected value creation from property acquisitions and trades; access to capital and the timing of development expenditures; environmental, weather, drilling and other operating risks; regulatory changes, including potential shut - ins or production curtailments mandated by the Railroad Commission of Texas, the Oklahoma Corporation Commission and/or the Kansas Corporation Commission; competition in the oil and natural gas industry; loss of production and leasehold rights due to mechanical failure or depletion of wells and our inability to re - establish their production; our ability to service our indebtedness; any downgrades in our credit ratings that could negatively impact our cost of and ability to access capital; cost inflation; the potential for significant new tariffs and their impact on global oil, natural gas and NGL markets; political and economic conditions and events in foreign oil and natural gas producing countries, including embargoes, continued hostilities in the Middle East and other sustained military campaigns, the war in Ukraine and associated economic sanctions on Russia, conditions in South America, Central America, China and Russia, and acts of terrorism or sabotage; evolving cybersecurity risks such as those involving unauthorized access, denial - of - service attacks, malicious software, data privacy breaches by employees, insiders or others with authorized access, cyber or phishing - attacks, ransomware, social engineering, physical breaches or other actions; and risks related to our ability to expand our business, including through the recruitment and retention of qualified personnel. Please read the Company’s filings with the SEC, including “Risk Factors” in the Company’s Annual Report on Form 10 - K, which is on file with the SEC, for a discussion of risks and uncertainties that could cause actual results to differ from those in such forward - looking statements. As a result, these forward - looking statements are not a guarantee of our performance, and you should not place undue reliance on such statements. Any forward - looking statement speaks only as of the date on which such statement is made, and the Company undertakes no obligation to correct or update any forward - looking statement, whether as a result of new information, future events or otherwise. Investor Relations Contact Mach Natural Resources 405 - 252 - 8100 | ir@machnr.com CAUTIONARY NOTE References to the Company’s estimated proved reserves are derived from the Company’s reserve reports prepared by Cawley Gillespie & Associates, Inc. (“CGA”), the Company’s independent petroleum engineers. Reserve engineering is a process of estimating underground accumulations of oil and natural gas that cannot be measured in an exact way. The accuracy of any reserve estimate depends on the quality of available data, the interpretation of such data and price and cost assumptions made by reservoir engineers. In addition, the results of drilling, testing and production activities may justify revisions of estimates that were made previously. If significant, such revisions would change the schedule of any further production and development drilling. Accordingly, our reserve and PV - 10 estimates may differ significantly from the quantities of oil, natural gas and NGLs that are ultimately recovered. You should not assume that the present values referred to in this presentation represent the actual current market value of our oil, natural gas and NGL reserves. The industry in which we operate is subject to a high degree of uncertainty and risk due to a variety of factors, which could cause our results to differ materially from those expressed in these third - party publications. This presentation contains trademarks, trade names and service marks of other companies, which are the property of their respective owners. We do not intend our use or display of other parties’ trademarks, trade names or service marks to imply, and such use or display should not be construed to imply, a relationship with, or endorsement or sponsorship of us by, these other parties. Nothing herein should be construed as legal, financial, tax or other advice. You should consult your own advisers concerning any legal, financial, tax or other considerations concerning the opportunity described herein. The general explanations included in this presentation cannot address, and are not intended to address, your specific investment objectives, financial situation or financial needs. NON - GAAP FINANCIAL INFORMATION This presentation includes certain financial measures that are not presented in accordance with U.S. generally accepted accounting principles (“GAAP”), including Adjusted EBITDA, Net Debt and PV - 10. In the case of Pro forma non - GAAP financial measures or non - GAAP financial measures presented for future periods, the Company advises that it is unable to provide reconciliations of such measures without unreasonable effort. Accordingly, such measures should be considered in light of the fact that no GAAP measure of performance or liquidity is available as a point of comparison to such non - GAAP measures. This presentation is being provided by Mach Natural Resources LP (the “Company”) for informational purposes only . No persons have been authorized to make any representations regarding the information contained in this presentation, and if given or made, such representations should not be considered as authorized . None of the Company, its respective affiliates or any of its or their respective employees, directors, officers, contractors, advisors, members, successors, representatives or agents makes any representation, warranty or undertaking, express or implied, and no reliance should be placed on, the fairness, accuracy, completeness or correctness of the information or the opinions contained herein . The information herein, including the forward - looking statements described below, has been prepared by the Company solely for use in this presentation, has not been independently verified and should be considered in the context of the circumstances prevailing at the time of its preparation . Management is under no obligation to update the information contained herein to reflect material developments which may occur after the date of the presentation . The Company may alter, modify or otherwise change in any manner the content of this presentation, without obligation to notify any person of such revision or changes .
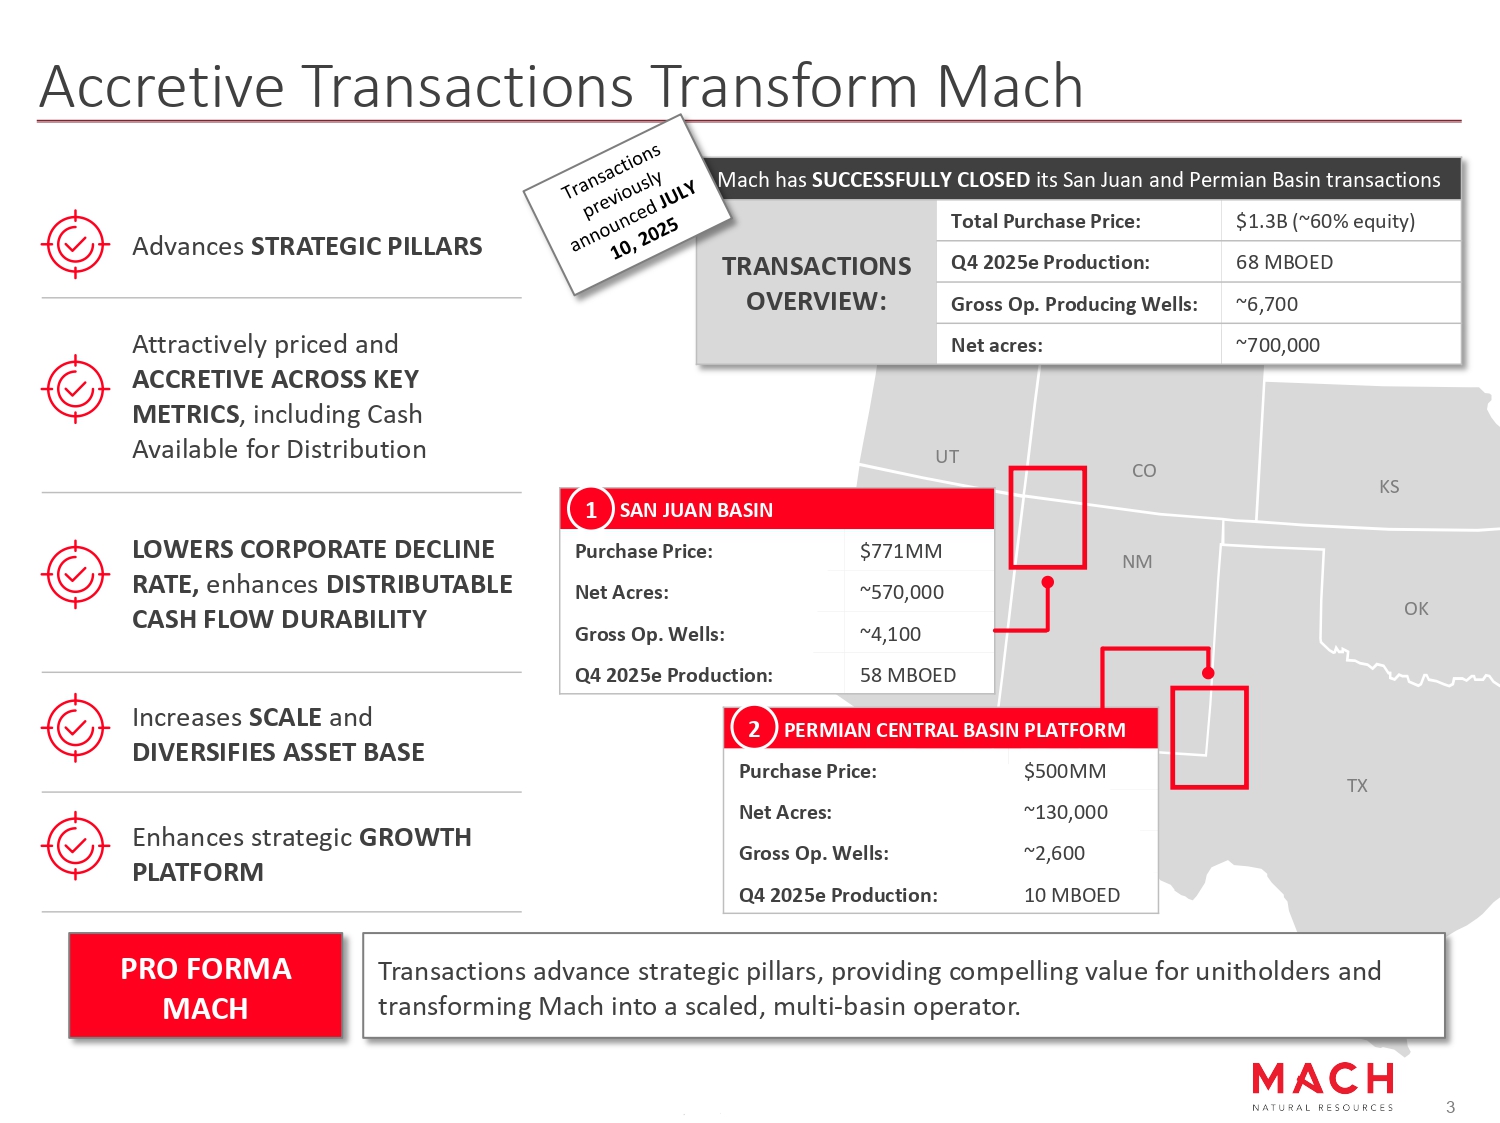
Advances STRATEGIC PILLARS Attractively priced and ACCRETIVE ACROSS KEY METRICS , including Cash Available for Distribution LOWERS CORPORATE DECLINE RATE, enhances DISTRIBUTABLE CASH FLOW DURABILITY Increases SCALE and DIVERSIFIES ASSET BASE Enhances strategic GROWTH PLATFORM Accretive Transactions Transform Mach Purchase Price: Net Acres: $500MM ~130,000 Gross Op. Wells: ~2,600 Q4 2025e Production: 10 MBOED Purchase Price: $771MM Net Acres: ~570,000 Gross Op. Wells: Q4 2025e Production: ~4,100 58 MBOED TX NM CO KS UT Mach has SUCCESSFULLY CLOSED its San Juan and Permian Basin transactions $1.3B (~60% equity) Total Purchase Price: TRANSACTIONS OVERVIEW: 68 MBOED Q4 2025e Production: ~6,700 Gross Op. Producing Wells: ~700,000 Net acres: OK PRO FORMA MACH Transactions advance strategic pillars, providing compelling value for unitholders and transforming Mach into a scaled, multi - basin operator. 1 SAN JUAN BASIN 2 PERMIAN CENTRAL BASIN PLATFORM 3
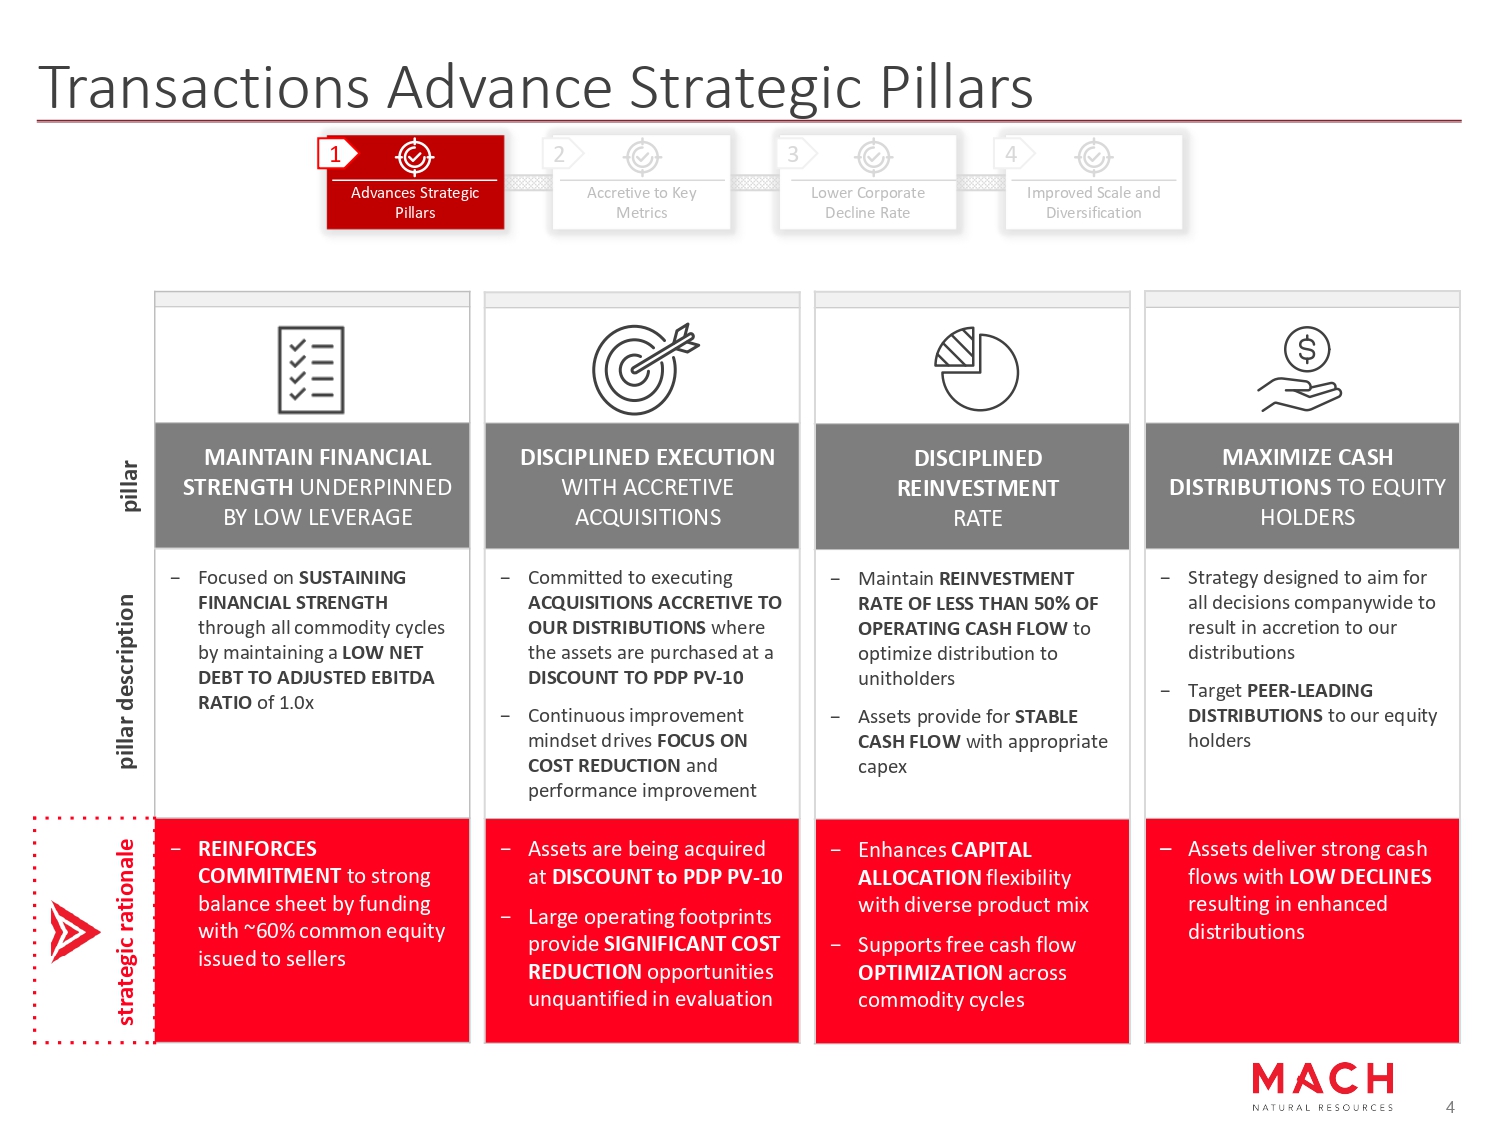
Transactions Advance Strategic Pillars DISCIPLINED EXECUTION WITH ACCRETIVE ACQUISITIONS − Committed to executing ACQUISITIONS ACCRETIVE TO OUR DISTRIBUTIONS where the assets are purchased at a DISCOUNT TO PDP PV - 10 − Continuous improvement mindset drives FOCUS ON COST REDUCTION and performance improvement − Assets are being acquired at DISCOUNT to PDP PV - 10 − Large operating footprints provide SIGNIFICANT COST REDUCTION opportunities unquantified in evaluation DISCIPLINED REINVESTMENT RATE − Maintain REINVESTMENT RATE OF LESS THAN 50% OF OPERATING CASH FLOW to optimize distribution to unitholders − Assets provide for STABLE CASH FLOW with appropriate capex − Enhances CAPITAL ALLOCATION flexibility with diverse product mix − Supports free cash flow OPTIMIZATION across commodity cycles strategic rationale pillar description pillar MAINTAIN FINANCIAL STRENGTH UNDERPINNED BY LOW LEVERAGE − Focused on SUSTAINING FINANCIAL STRENGTH through all commodity cycles by maintaining a LOW NET DEBT TO ADJUSTED EBITDA RATIO of 1.0x − REINFORCES COMMITMENT to strong balance sheet by funding with ~60% common equity issued to sellers MAXIMIZE CASH DISTRIBUTIONS TO EQUITY HOLDERS − Strategy designed to aim for all decisions companywide to result in accretion to our distributions − Target PEER - LEADING DISTRIBUTIONS to our equity holders – Assets deliver strong cash flows with LOW DECLINES resulting in enhanced distributions Advances Strategic Accretive to Key Lower Corporate Improved Scale and Pillars Metrics Decline Rate Diversification 1 2 3 4 4
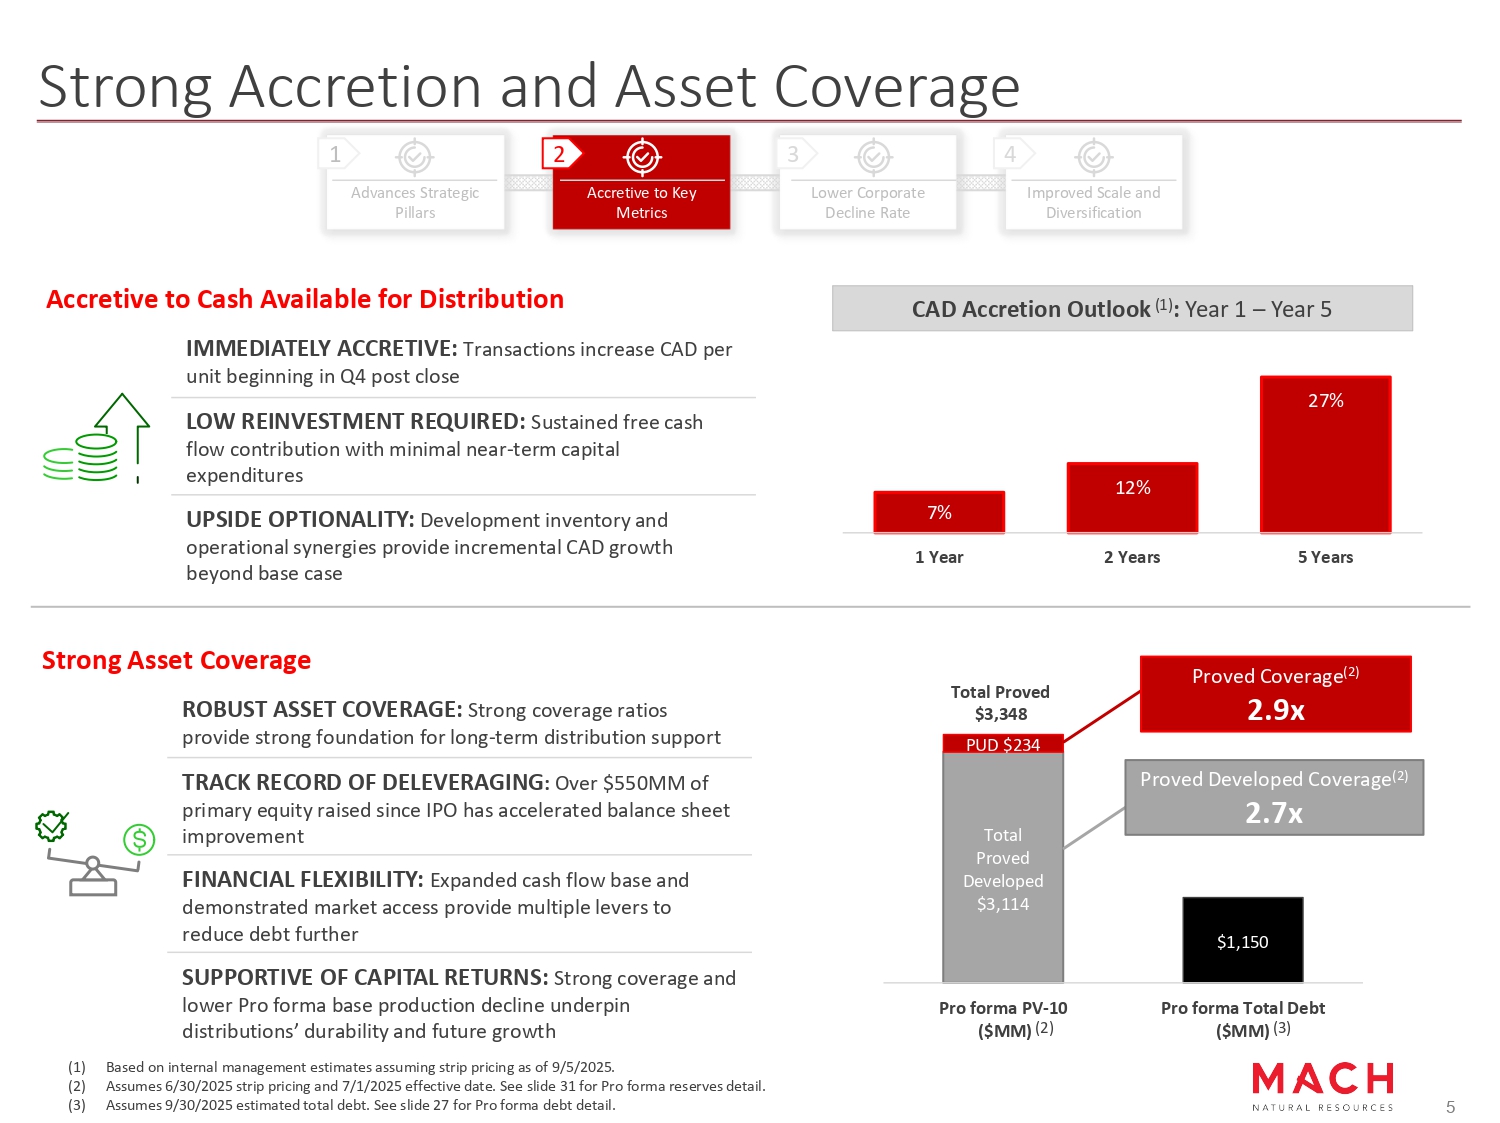
5 CAD Accretion Outlook (1) : Year 1 – Year 5 Strong Accretion and Asset Coverage Total Proved Developed $3,114 $1,150 PUD $234 Pro forma PV - 10 ($MM) (2) Pro forma Total Debt ($MM) (3) Accretive to Cash Available for Distribution IMMEDIATELY ACCRETIVE: Transactions increase CAD per unit beginning in Q4 post close LOW REINVESTMENT REQUIRED: Sustained free cash flow contribution with minimal near - term capital expenditures UPSIDE OPTIONALITY : Development inventory and operational synergies provide incremental CAD growth beyond base case Strong Asset Coverage ROBUST ASSET COVERAGE: Strong coverage ratios provide strong foundation for long - term distribution support TRACK RECORD OF DELEVERAGING : Over $550MM of primary equity raised since IPO has accelerated balance sheet improvement FINANCIAL FLEXIBILITY: Expanded cash flow base and demonstrated market access provide multiple levers to reduce debt further SUPPORTIVE OF CAPITAL RETURNS: Strong coverage and lower Pro forma base production decline underpin distributions’ durability and future growth 7% 12% 27% 1 Year 2 Years 5 Years Proved Developed Coverage (2) 2.7x Proved Coverage (2) 2.9x Advances Strategic Accretive to Key Lower Corporate Improved Scale and Pillars Metrics Decline Rate Diversification 1 2 3 4 (1) Based on internal management estimates assuming strip pricing as of 9/5/2025. (2) Assumes 6/30/2025 strip pricing and 7/1/2025 effective date. See slide 31 for Pro forma reserves detail. (3) Assumes 9/30/2025 estimated total debt. See slide 27 for Pro forma debt detail. Total Proved $3,348
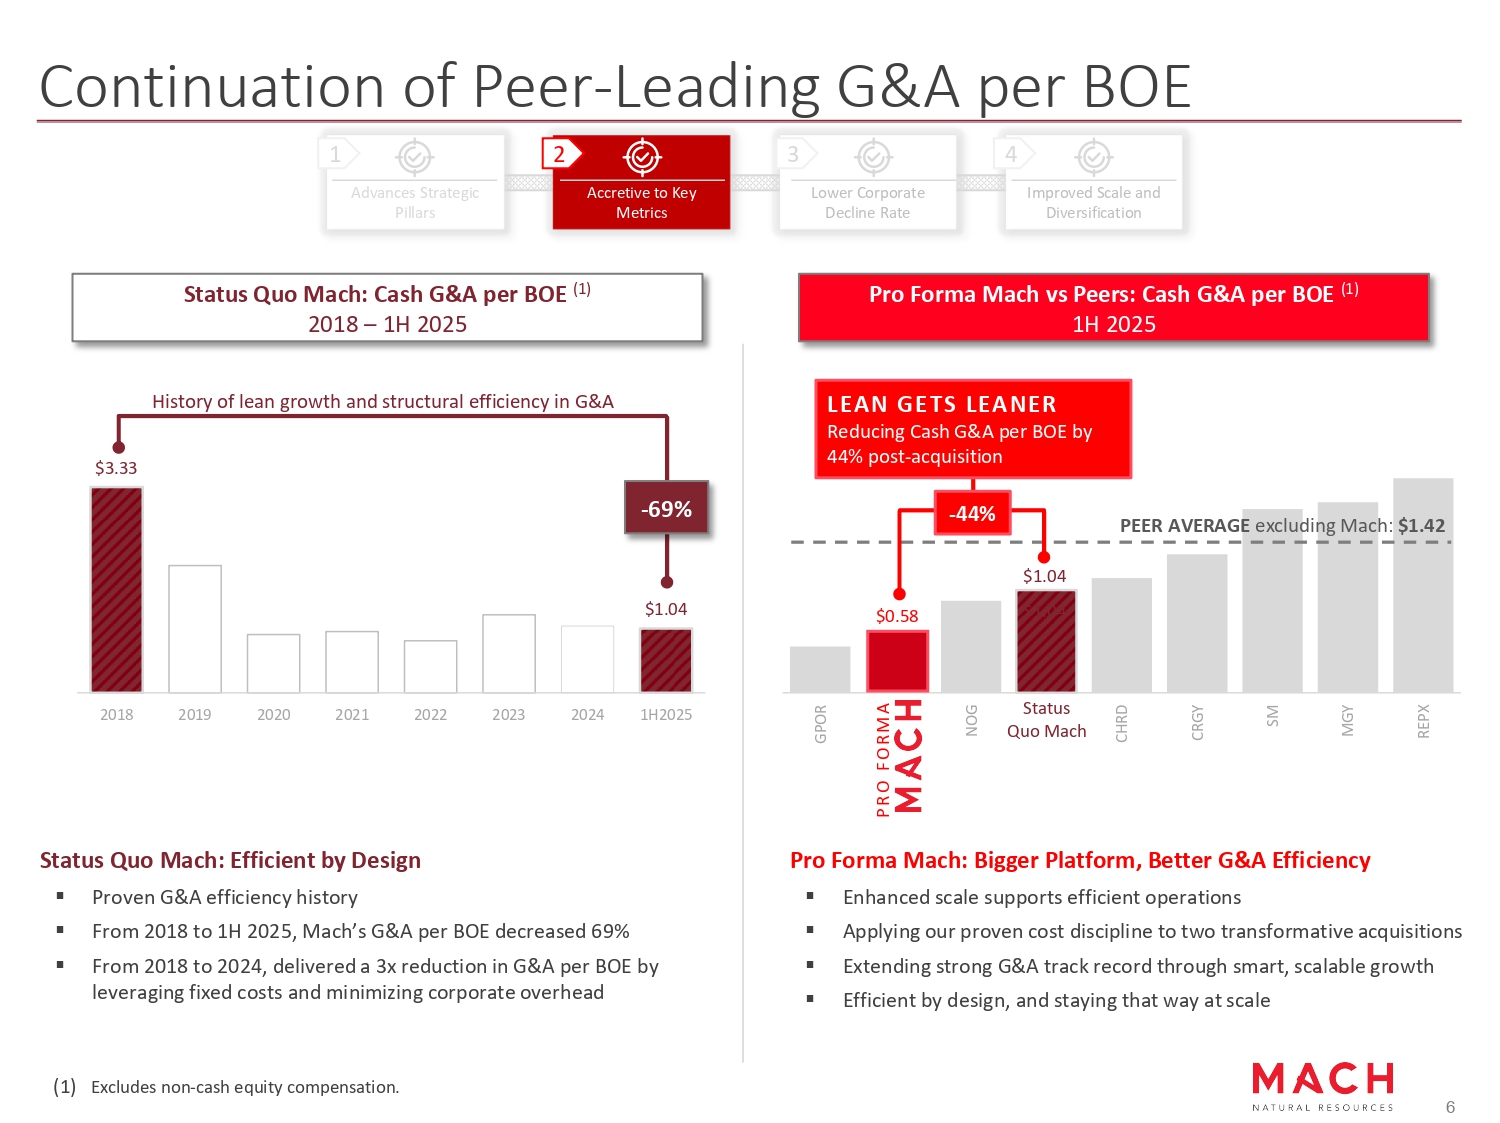
Continuation of Peer - Leading G&A per BOE (1) Excludes non - cash equity compensation. GPOR PF Mach NOG SQ Mach CHRD CRGY SM MGY REPX $3.33 $1.04 2018 2019 2020 2021 2022 2023 2024 1H2025 Status Quo Mach: Efficient by Design ▪ Proven G&A efficiency history ▪ From 2018 to 1H 2025, Mach’s G&A per BOE decreased 69% ▪ From 2018 to 2024, delivered a 3x reduction in G&A per BOE by leveraging fixed costs and minimizing corporate overhead Pro Forma Mach vs Peers: Cash G&A per BOE (1) 1H 2025 Status Quo Mach: Cash G&A per BOE (1) 2018 – 1H 2025 Pro Forma Mach: Bigger Platform, Better G&A Efficiency ▪ Enhanced scale supports efficient operations ▪ Applying our proven cost discipline to two transformative acquisitions ▪ Extending strong G&A track record through smart, scalable growth ▪ Efficient by design, and staying that way at scale History of lean growth and structural efficiency in G&A LEAN GETS LEANER Reducing Cash G&A per BOE by 44% post - acquisition PEER AVERAGE excluding Mach: $1.42 - 69% - 44% $1.04 $0.58 Advances Strategic Accretive to Key Lower Corporate Improved Scale and Pillars Metrics Decline Rate Diversification 1 2 3 4 P R O F O R M A $1.04 6 Status Quo Mach
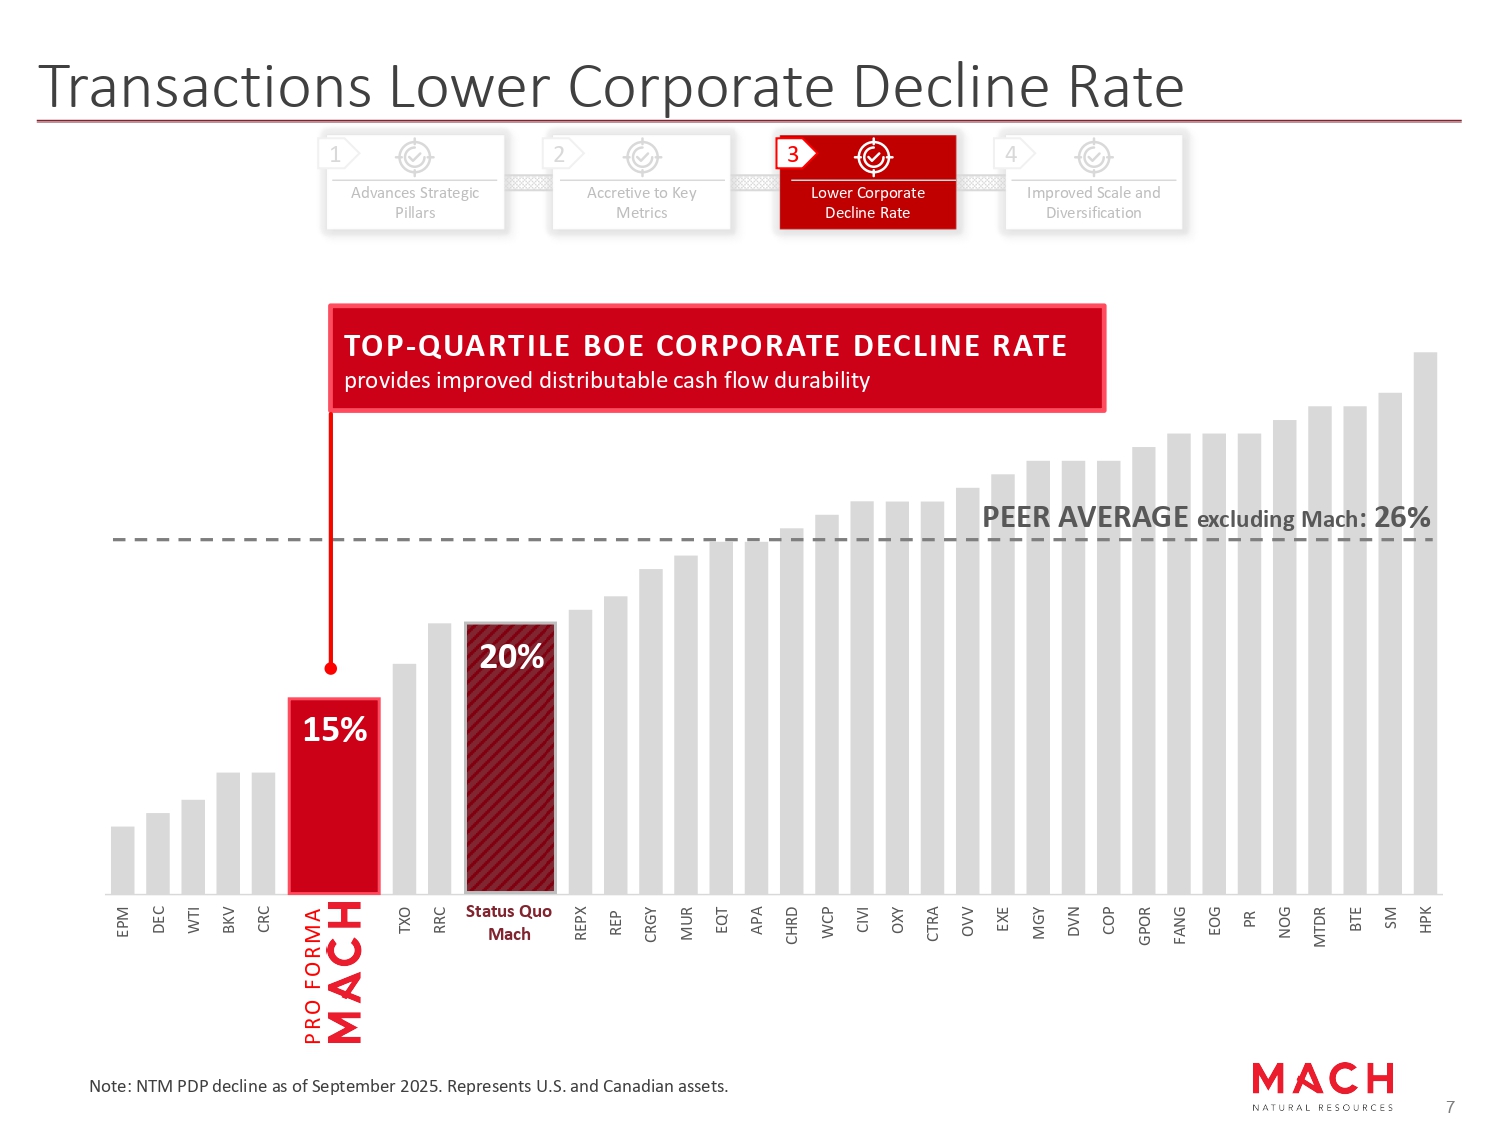
Transactions Lower Corporate Decline Rate EPM DEC WTI BKV CRC Pro Forma Mach TXO RRC Status Quo Mach REPX REP CRGY MUR EQT APA CHRD WCP CIVI OXY CTRA OVV EXE MGY DVN COP GPOR FANG EOG PR NOG MTDR BTE SM HPK PEER AVERAGE excluding Mach : 26% TOP - QUARTILE BOE CORPORATE DECLINE RATE provides improved distributable cash flow durability 20% 15% Advances Strategic Accretive to Key Lower Corporate Improved Scale and Pillars Metrics Decline Rate Diversification 1 2 3 4 Status Quo Mach Note: NTM PDP decline as of September 2025. Represents U.S. and Canadian assets. PRO FORMA 7
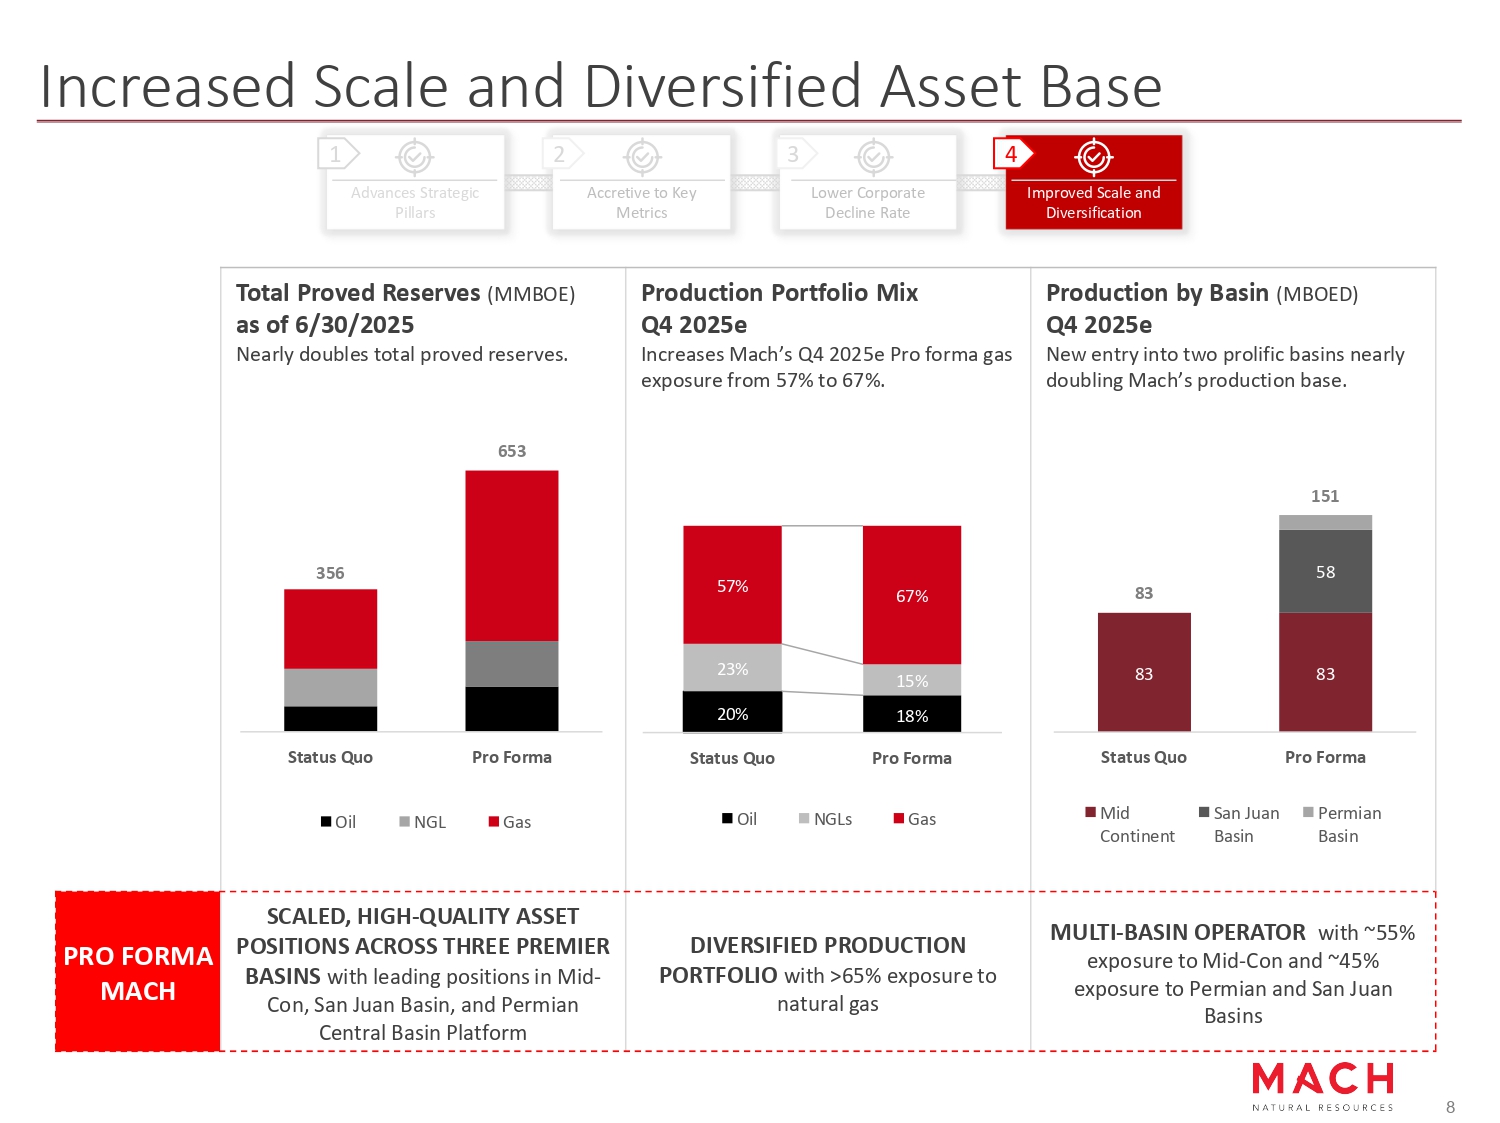
Increased Scale and Diversified Asset Base Advances Strategic Accretive to Key Lower Corporate Improved Scale and Pillars Metrics Decline Rate Diversification 1 2 3 4 Production by Basin (MBOED) Q4 2025e New entry into two prolific basins nearly doubling Mach’s production base. 151 58 83 83 83 Status Quo Pro Forma Mid San Juan Permian Continent Basin Basin Production Portfolio Mix Q4 2025e Increases Mach’s Q4 2025e Pro forma gas exposure from 57% to 67%. Total Proved Reserves (MMBOE) as of 6/30/2025 Nearly doubles total proved reserves. 653 356 Status Quo Pro Forma Oil NGL Gas 67% 57% 23% 15% 18% 20% Status Quo Pro Forma Oil NGLs Gas MULTI - BASIN OPERATOR with ~55% exposure to Mid - Con and ~45% exposure to Permian and San Juan Basins DIVERSIFIED PRODUCTION PORTFOLIO with >65% exposure to natural gas SCALED, HIGH - QUALITY ASSET POSITIONS ACROSS THREE PREMIER BASINS with leading positions in Mid - Con, San Juan Basin, and Permian Central Basin Platform PRO FORMA MACH 8
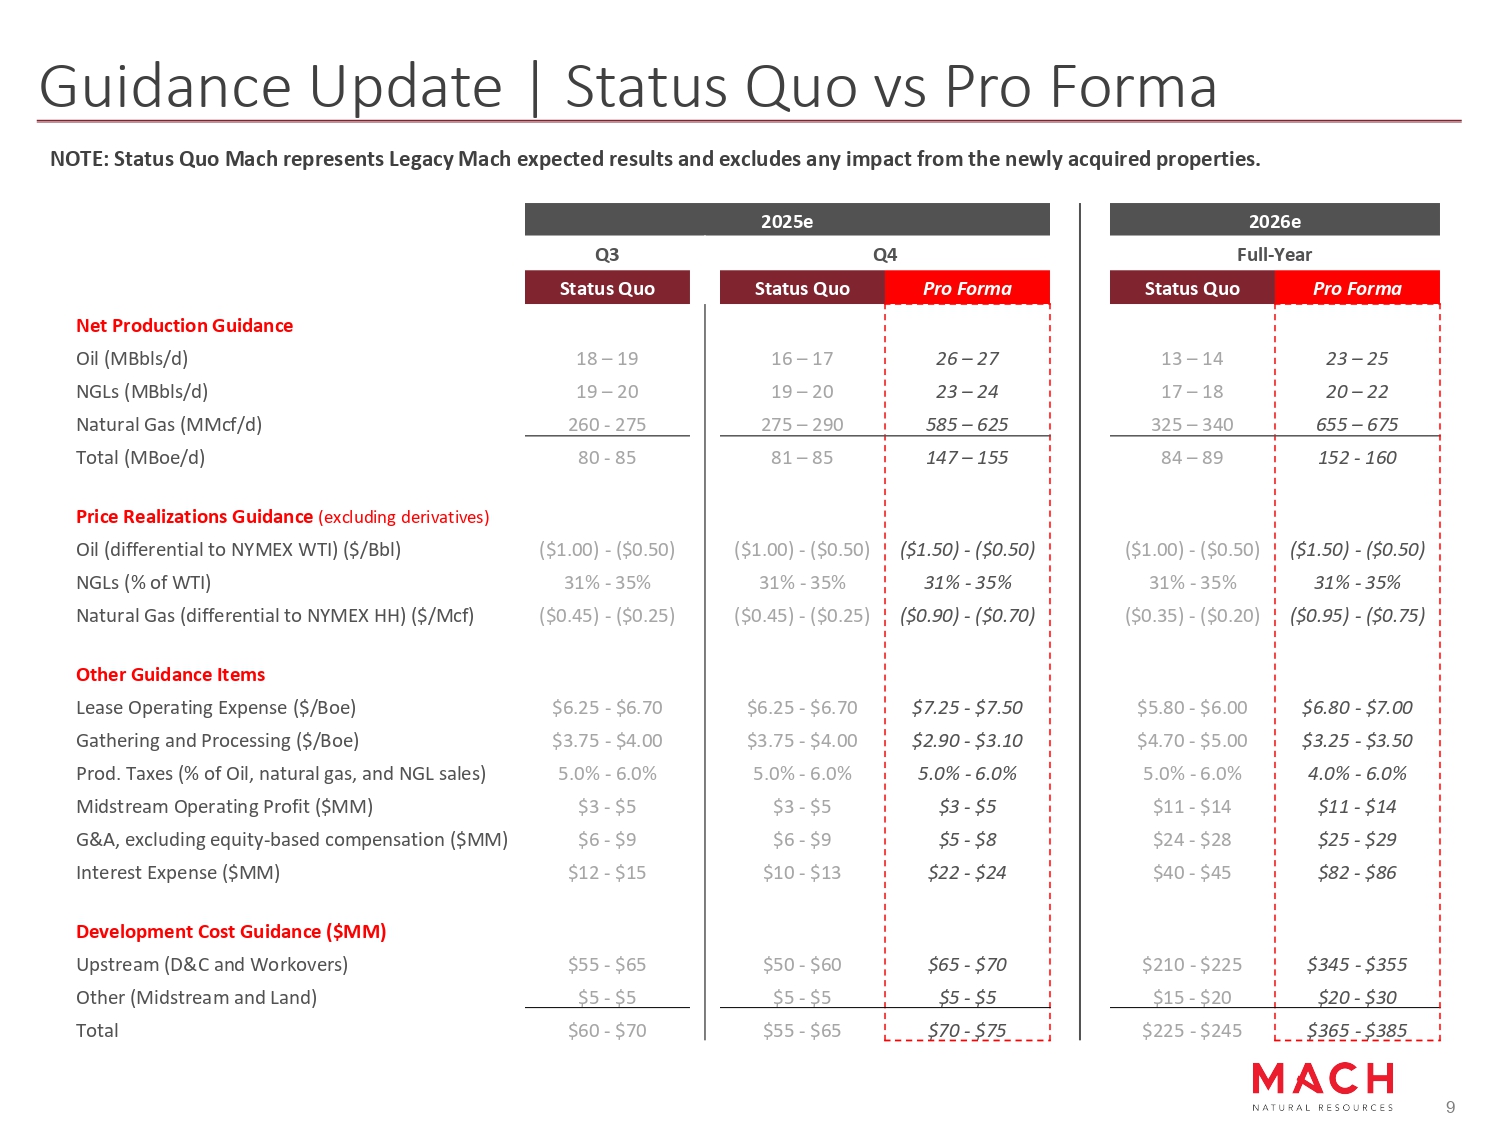
Guidance Update | Status Quo vs Pro Forma Pro Forma Status Quo 26 – 27 16 – 17 23 – 24 19 – 20 585 – 625 275 – 290 147 – 155 81 – 85 ($1.50) - ($0.50) ($1.00) - ($0.50) 31% - 35% 31% - 35% ($0.90) - ($0.70) ($0.45) - ($0.25) $7.25 - $7.50 $6.25 - $6.70 $2.90 - $3.10 $3.75 - $4.00 5.0% - 6.0% 5.0% - 6.0% $3 - $5 $3 - $5 $5 - $8 $6 - $9 $22 - $24 $10 - $13 $65 - $70 $50 - $60 $5 - $5 $5 - $5 $70 - $75 $55 - $65 Pro Forma Status Quo 23 – 25 13 – 14 20 – 22 17 – 18 655 – 675 325 – 340 152 - 160 84 – 89 ($1.50) - ($0.50) ($1.00) - ($0.50) 31% - 35% 31% - 35% ($0.95) - ($0.75) ($0.35) - ($0.20) $6.80 - $7.00 $5.80 - $6.00 $3.25 - $3.50 $4.70 - $5.00 4.0% - 6.0% 5.0% - 6.0% $11 - $14 $11 - $14 $25 - $29 $24 - $28 $82 - $86 $40 - $45 $345 - $355 $210 - $225 $20 - $30 $15 - $20 $365 - $385 $225 - $245 NOTE: Status Quo Mach represents Legacy Mach expected results and excludes any impact from the newly acquired properties. 2025e 2026e Q3 Q4 Full - Year 9 Status Quo Net Production Guidance Oil (MBbls/d) NGLs (MBbls/d) Natural Gas (MMcf/d) Total (MBoe/d) 18 – 19 19 – 20 260 - 275 80 - 85 Price Realizations Guidance (excluding derivatives) Oil (differential to NYMEX WTI) ($/Bbl) NGLs (% of WTI) Natural Gas (differential to NYMEX HH) ($/Mcf) ($1.00) - ($0.50) 31% - 35% ($0.45) - ($0.25) Other Guidance Items Lease Operating Expense ($/Boe) Gathering and Processing ($/Boe) Prod. Taxes (% of Oil, natural gas, and NGL sales) Midstream Operating Profit ($MM) G&A, excluding equity - based compensation ($MM) Interest Expense ($MM) $6.25 - $6.70 $3.75 - $4.00 5.0% - 6.0% $3 - $5 $6 - $9 $12 - $15 Development Cost Guidance ($MM) Upstream (D&C and Workovers) Other (Midstream and Land) Total $55 - $65 $5 - $5 $60 - $70

Mach Resources. All Rights Reserved. 10 Asset Portfolio
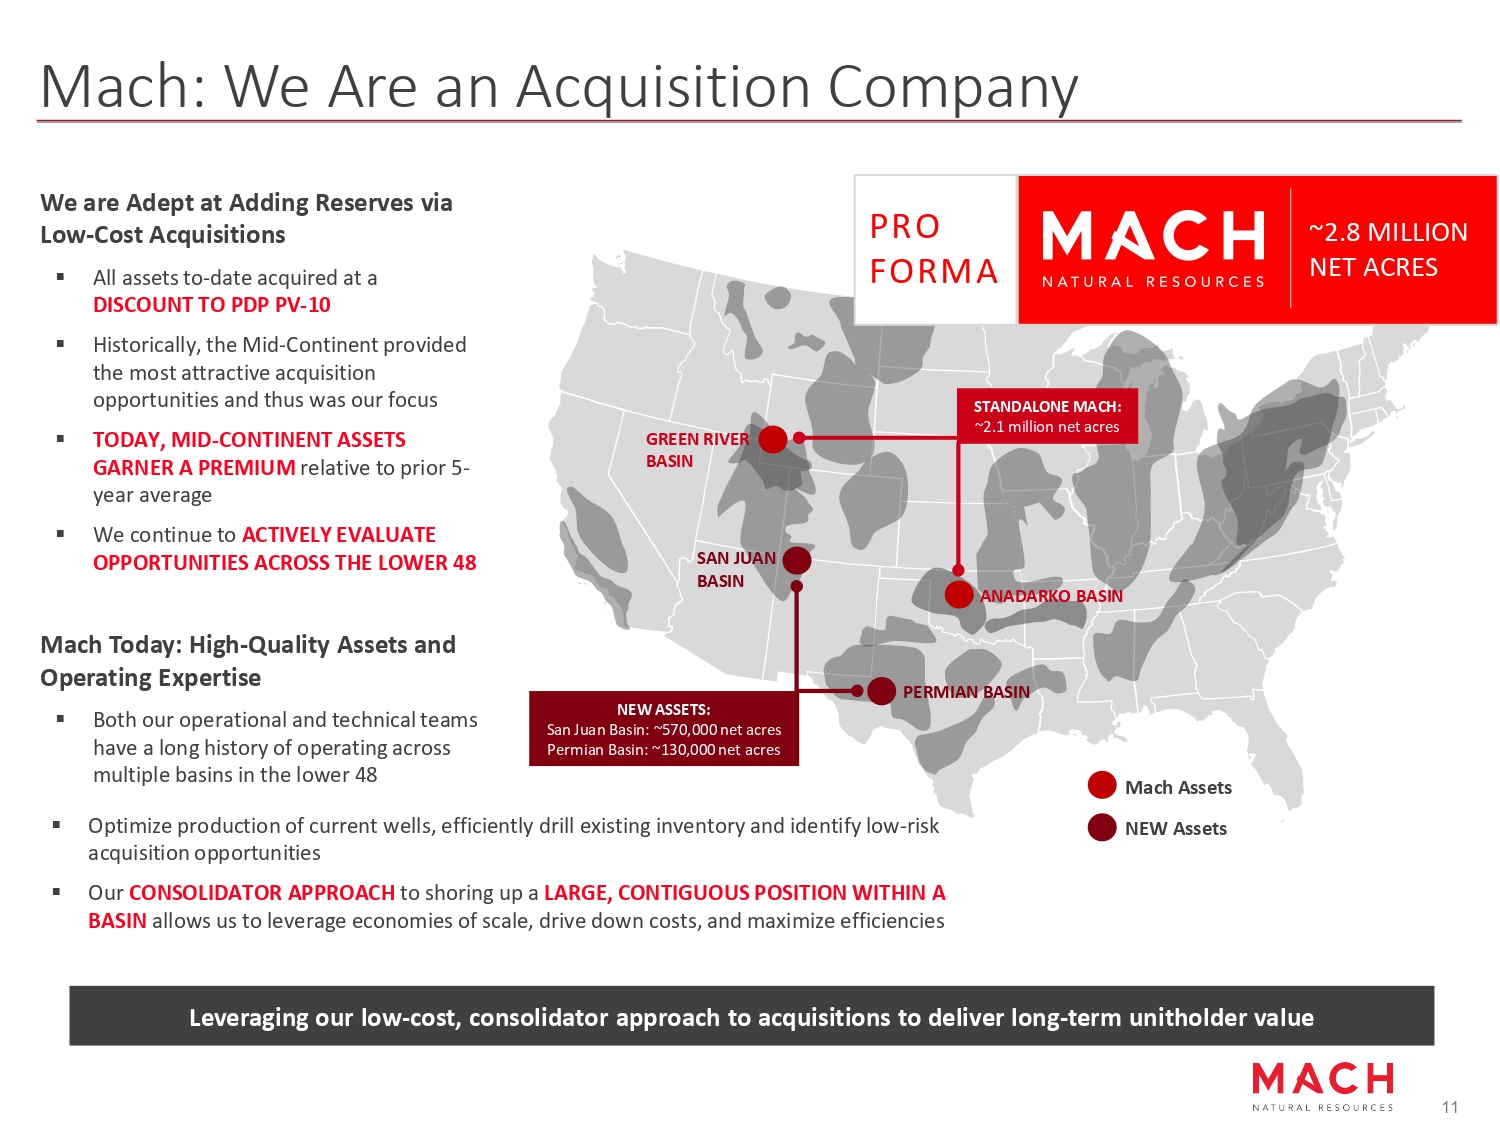
Mach: We Are an Acquisition Company We are Adept at Adding Reserves via Low - Cost Acquisitions ▪ All assets to - date acquired at a DISCOUNT TO PDP PV - 10 ▪ Historically, the Mid - Continent provided the most attractive acquisition opportunities and thus was our focus ▪ TODAY, MID - CONTINENT ASSETS GARNER A PREMIUM relative to prior 5 - year average ▪ We continue to ACTIVELY EVALUATE OPPORTUNITIES ACROSS THE LOWER 48 Mach Today: High - Quality Assets and Operating Expertise ▪ Both our operational and technical teams have a long history of operating across multiple basins in the lower 48 Leveraging our low - cost, consolidator approach to acquisitions to deliver long - term unitholder value Mach Assets STANDALONE MACH: ~2.1 million net acres ▪ Optimize production of current wells, efficiently drill existing inventory and identify low - risk acquisition opportunities ▪ Our CONSOLIDATOR APPROACH to shoring up a LARGE, CONTIGUOUS POSITION WITHIN A BASIN allows us to leverage economies of scale, drive down costs, and maximize efficiencies ANADARKO BASIN NEW Assets PERMIAN BASIN SAN JUAN BASIN NEW ASSETS: San Juan Basin: ~570,000 net acres Permian Basin: ~130,000 net acres GREEN RIVER BASIN ~2.8 MILLION NET ACRES PRO FORMA 11
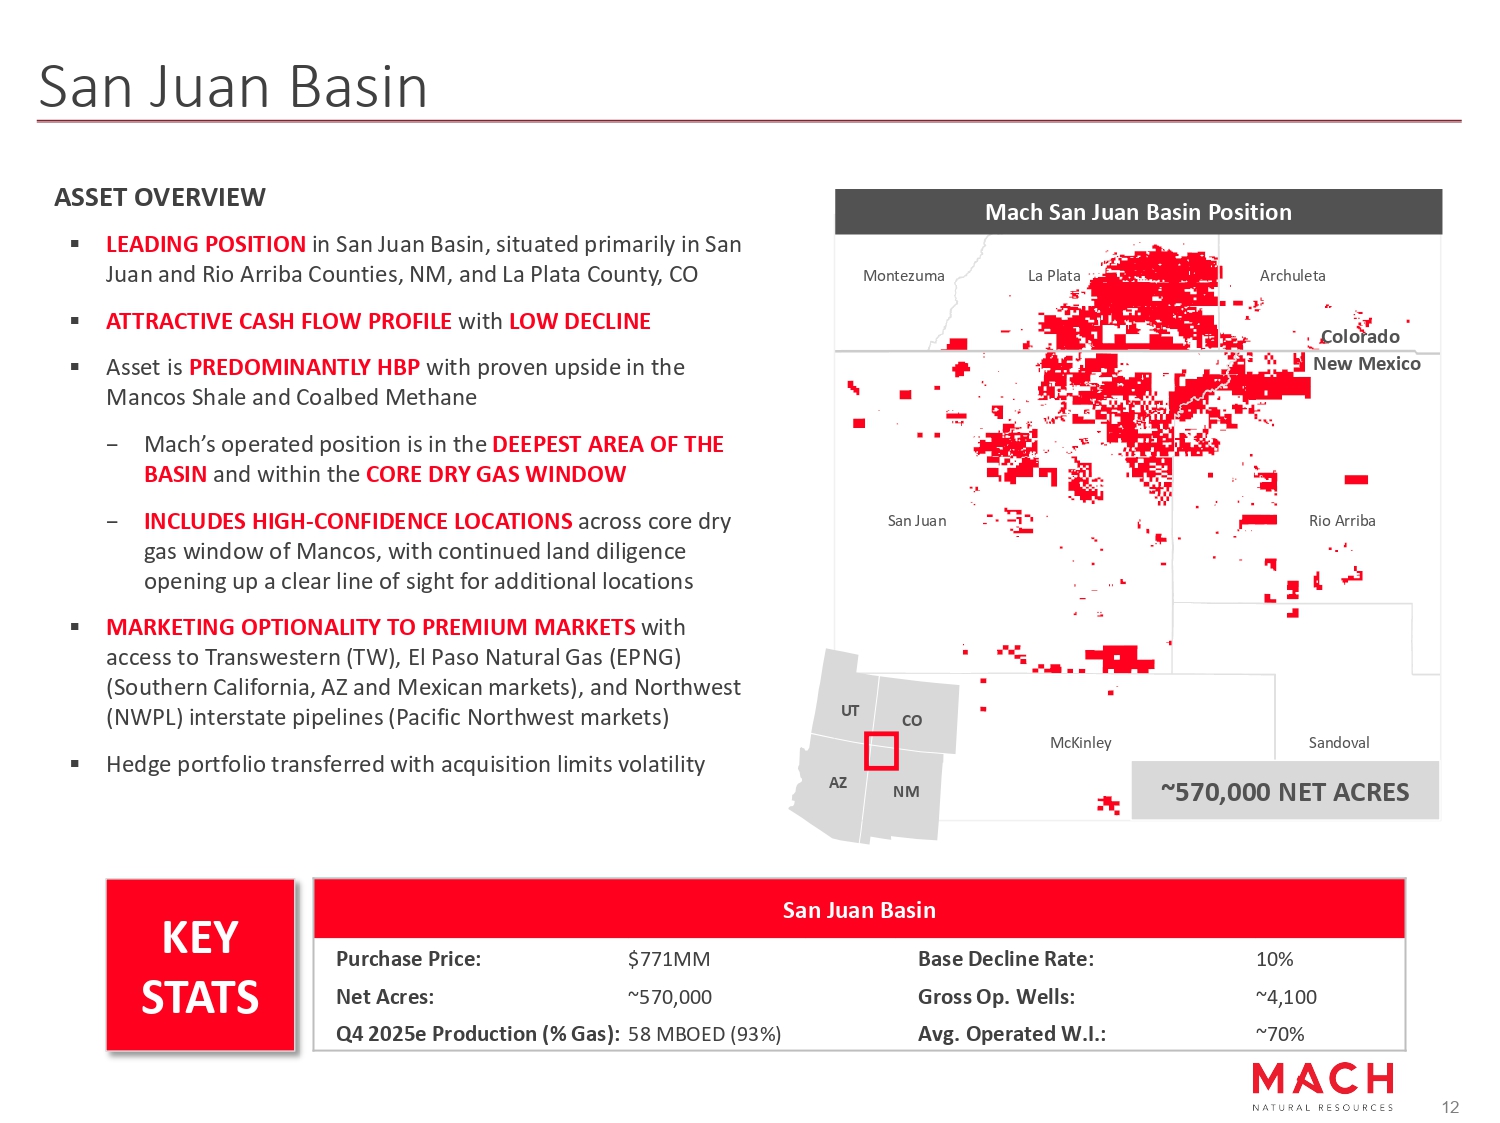
San Juan Basin ASSET OVERVIEW ▪ LEADING POSITION in San Juan Basin, situated primarily in San Juan and Rio Arriba Counties, NM, and La Plata County, CO ▪ ATTRACTIVE CASH FLOW PROFILE with LOW DECLINE ▪ Asset is PREDOMINANTLY HBP with proven upside in the Mancos Shale and Coalbed Methane − Mach’s operated position is in the DEEPEST AREA OF THE BASIN and within the CORE DRY GAS WINDOW − INCLUDES HIGH - CONFIDENCE LOCATIONS across core dry gas window of Mancos, with continued land diligence opening up a clear line of sight for additional locations ▪ MARKETING OPTIONALITY TO PREMIUM MARKETS with access to Transwestern (TW), El Paso Natural Gas (EPNG) (Southern California, AZ and Mexican markets), and Northwest (NWPL) interstate pipelines (Pacific Northwest markets) ▪ Hedge portfolio transferred with acquisition limits volatility San Juan Basin 10% Base Decline Rate: $771MM Purchase Price: ~4,100 Gross Op. Wells: ~570,000 Net Acres: ~70% Avg. Operated W.I.: 58 MBOED (93%) Q4 2025e Production (% Gas): Colorado New Mexico San Juan McKinley Rio Arriba Sandoval Montezuma La Plata Archuleta Mach San Juan Basin Position UT NM CO AZ ~570,000 NET ACRES KEY STATS 12
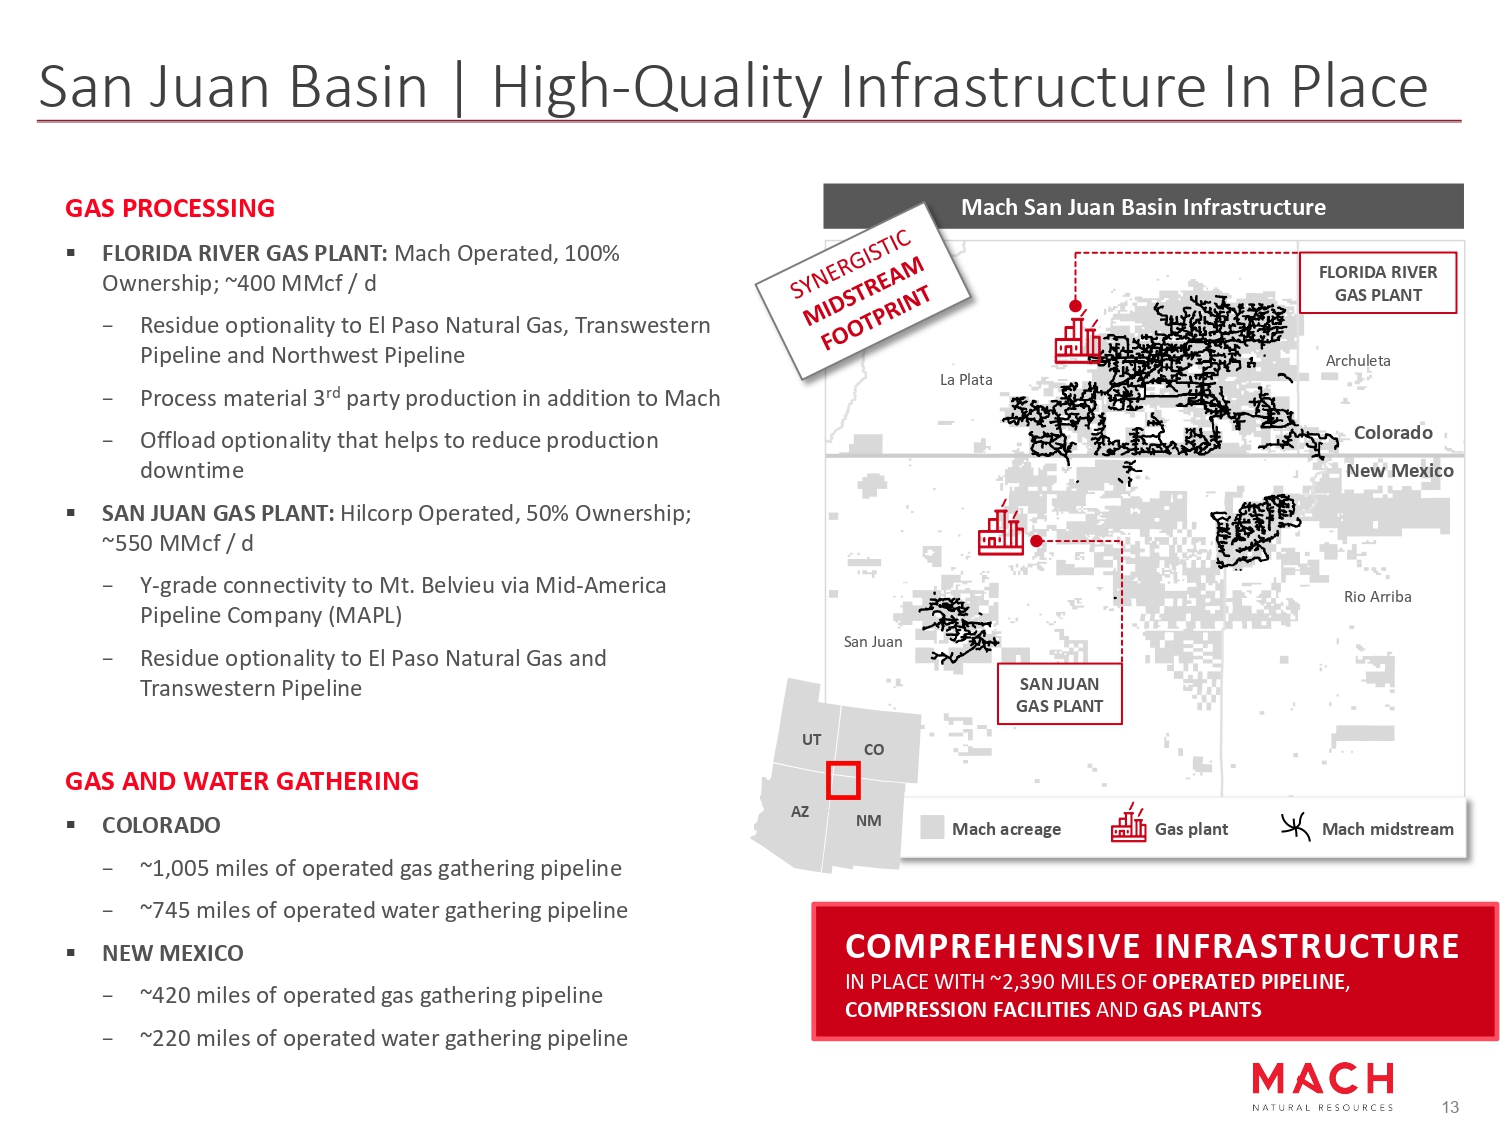
San Juan Basin | High - Quality Infrastructure In Place Mach San Juan Basin Infrastructure GAS PROCESSING ▪ FLORIDA RIVER GAS PLANT: Mach Operated, 100% Ownership; ~400 MMcf / d − Residue optionality to El Paso Natural Gas, Transwestern Pipeline and Northwest Pipeline − Process material 3 rd party production in addition to Mach − Offload optionality that helps to reduce production downtime ▪ SAN JUAN GAS PLANT: Hilcorp Operated, 50% Ownership; ~550 MMcf / d − Y - grade connectivity to Mt. Belvieu via Mid - America Pipeline Company (MAPL) − Residue optionality to El Paso Natural Gas and Transwestern Pipeline GAS AND WATER GATHERING ▪ COLORADO − ~1,005 miles of operated gas gathering pipeline − ~745 miles of operated water gathering pipeline ▪ NEW MEXICO − ~420 miles of operated gas gathering pipeline − ~220 miles of operated water gathering pipeline San Juan Archuleta Rio Arriba La Plata FLORIDA RIVER GAS PLANT SAN JUAN GAS PLANT Gas plant Mach acreage Mach midstream UT NM CO AZ COMPREHENSIVE INFRASTRUCTURE IN PLACE WITH ~2,390 MILES OF OPERATED PIPELINE , COMPRESSION FACILITIES AND GAS PLANTS New Mexico 13 Colorado
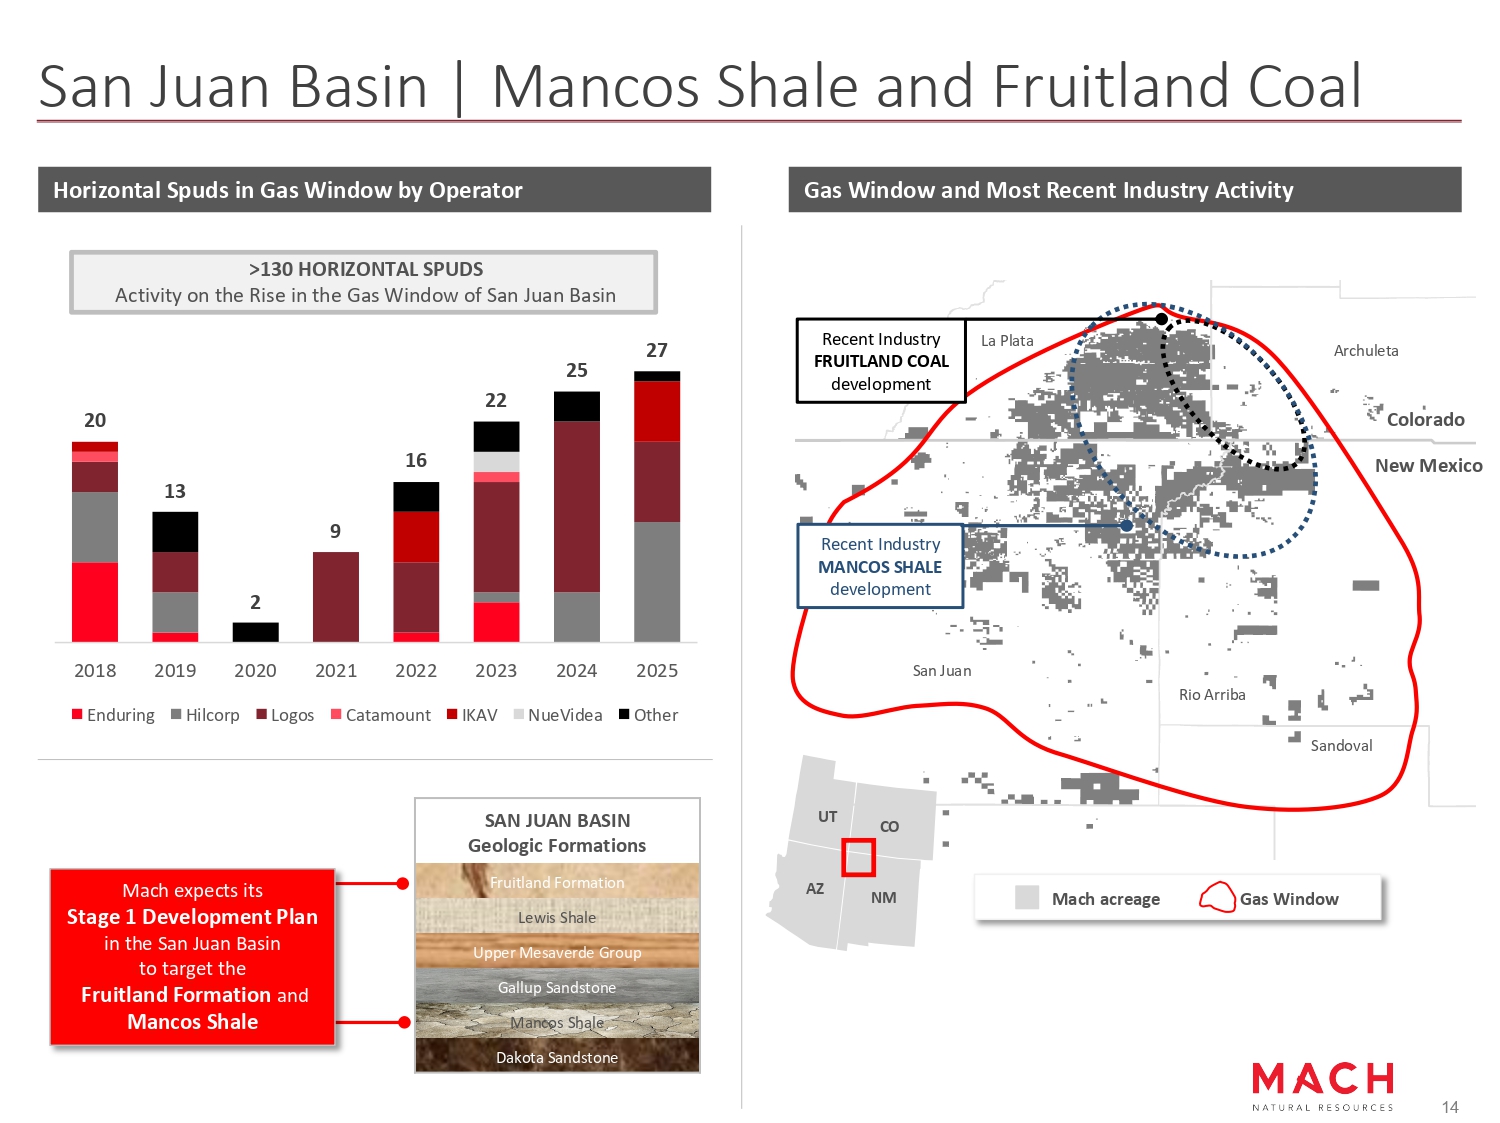
San Juan Basin | Mancos Shale and Fruitland Coal La Plata Archuleta Rio Arriba San Juan Sandoval New Mexico Colorado UT NM CO AZ Mach acreage Gas Window Recent Industry MANCOS SHALE development Gas Window and Most Recent Industry Activity Horizontal Spuds in Gas Window by Operator Recent Industry FRUITLAND COAL development SAN JUAN BASIN Geologic Formations Fruitland Formation Lewis Shale Upper Mesaverde Group Gallup Sandstone Mancos Shale Dakota Sandstone 20 13 2 9 16 22 25 27 2018 2019 2020 2023 2024 2025 Enduring Hilcorp Logos 2021 2022 Catamount IKAV NueVidea Other 14 >130 HORIZONTAL SPUDS Activity on the Rise in the Gas Window of San Juan Basin Mach expects its Stage 1 Development Plan in the San Juan Basin to target the Fruitland Formation and Mancos Shale
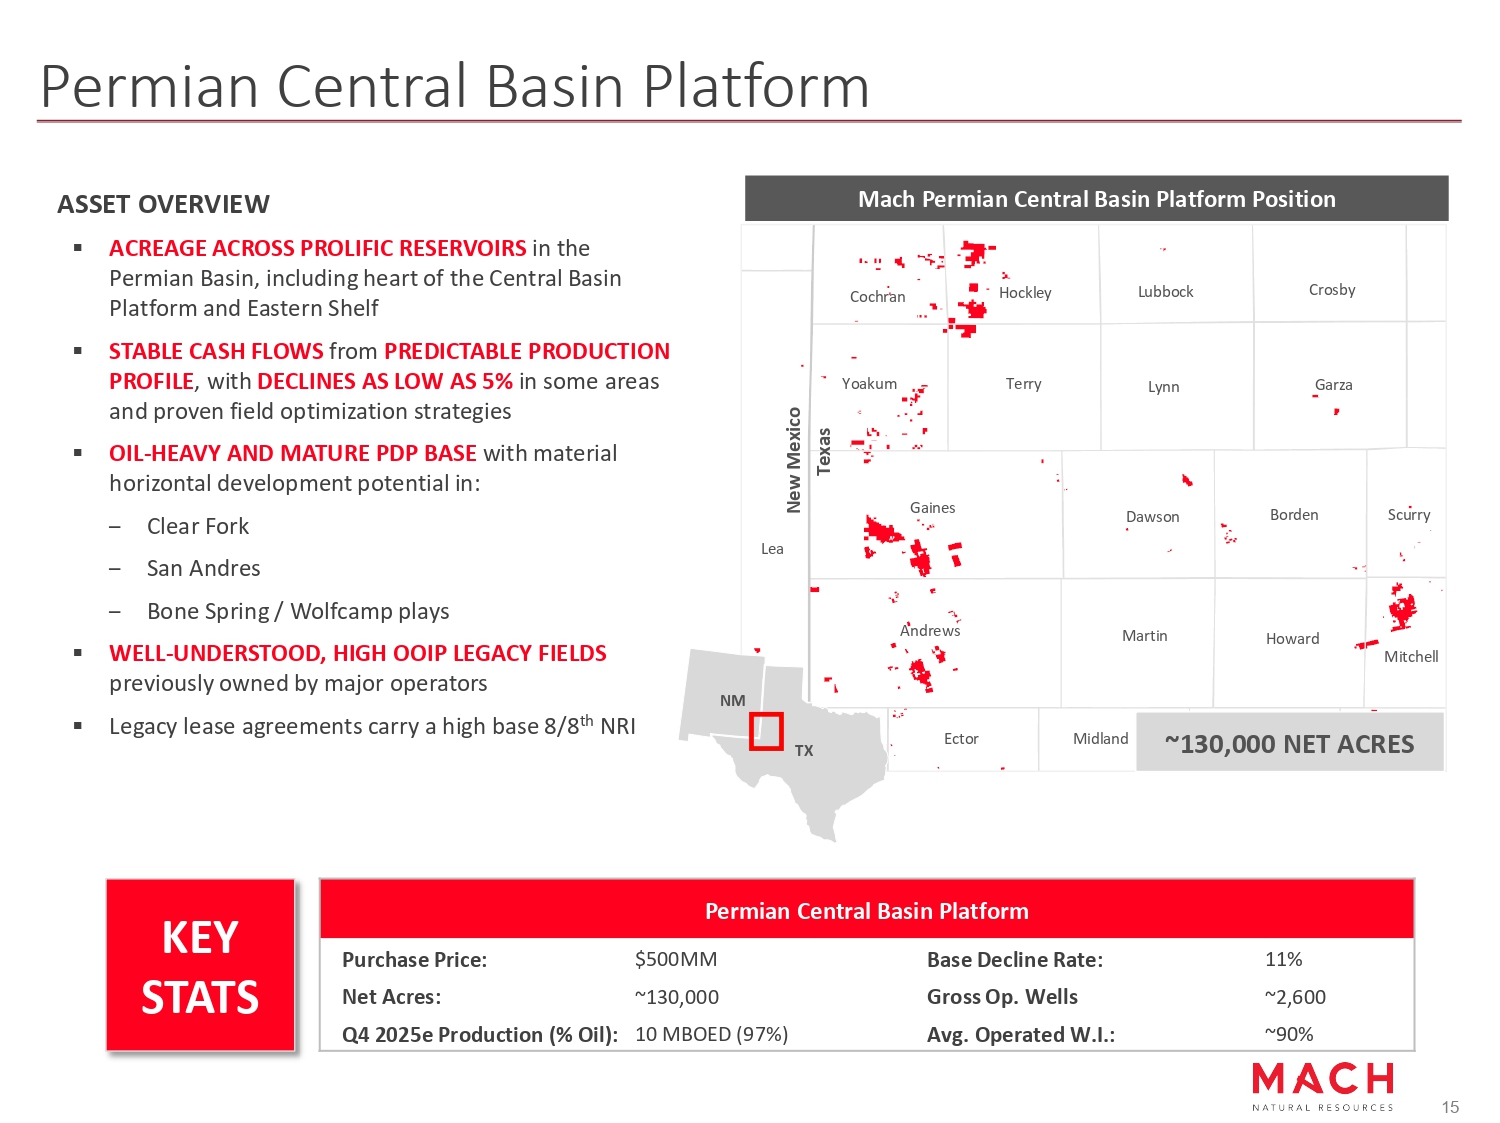
Permian Central Basin Platform ASSET OVERVIEW ▪ ACREAGE ACROSS PROLIFIC RESERVOIRS in the Permian Basin, including heart of the Central Basin Platform and Eastern Shelf ▪ STABLE CASH FLOWS from PREDICTABLE PRODUCTION PROFILE , with DECLINES AS LOW AS 5% in some areas and proven field optimization strategies ▪ OIL - HEAVY AND MATURE PDP BASE with material horizontal development potential in: – Clear Fork – San Andres – Bone Spring / Wolfcamp plays ▪ WELL - UNDERSTOOD, HIGH OOIP LEGACY FIELDS previously owned by major operators ▪ Legacy lease agreements carry a high base 8/8 th NRI Permian Central Basin Platform 11% Base Decline Rate: $500MM Purchase Price: ~2,600 Gross Op. Wells ~130,000 Net Acres: ~90% Avg. Operated W.I.: 10 MBOED (97%) Q4 2025e Production (% Oil): Mach Permian Central Basin Platform Position ~130,000 NET ACRES TX NM New Mexico Texas Andrews Gaines Cochran Hockley Terry Dawson Borden Scurry Martin Howard Mitchell Ector Midland Yoakum Lubbock Crosby Lynn Garza Lea KEY STATS 15
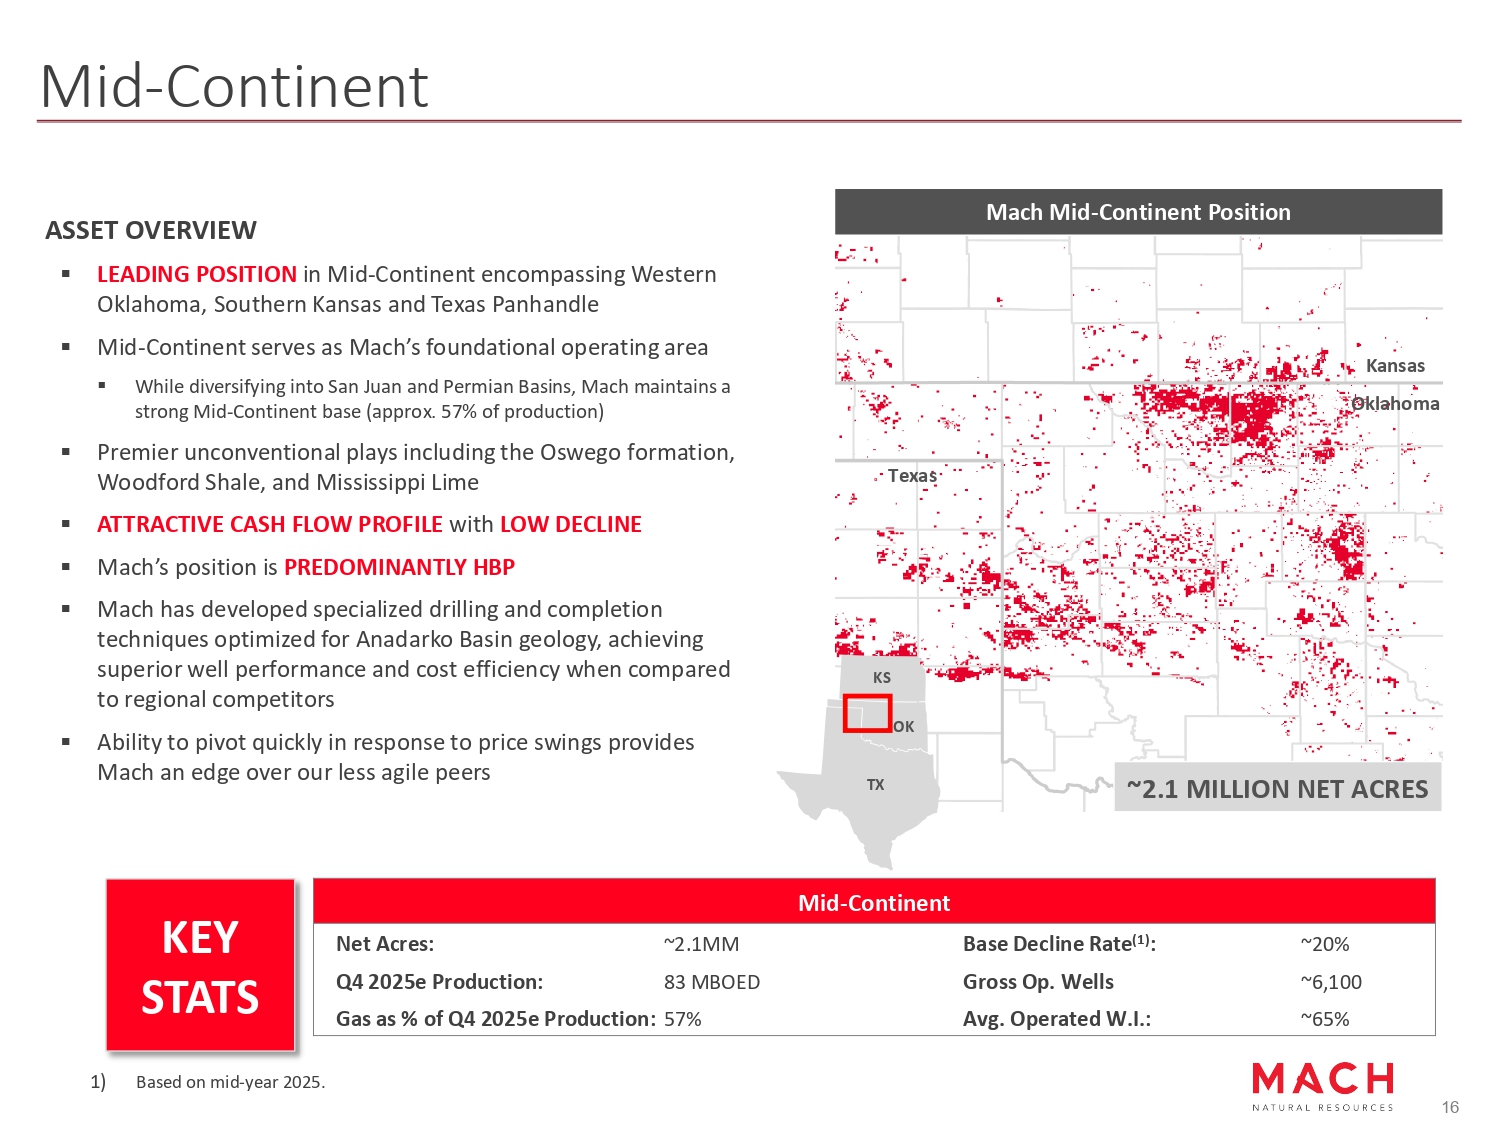
Mid - Continent ASSET OVERVIEW ▪ LEADING POSITION in Mid - Continent encompassing Western Oklahoma, Southern Kansas and Texas Panhandle ▪ Mid - Continent serves as Mach’s foundational operating area ▪ While diversifying into San Juan and Permian Basins, Mach maintains a strong Mid - Continent base (approx. 57% of production) ▪ Premier unconventional plays including the Oswego formation, Woodford Shale, and Mississippi Lime ▪ ATTRACTIVE CASH FLOW PROFILE with LOW DECLINE ▪ Mach’s position is PREDOMINANTLY HBP ▪ Mach has developed specialized drilling and completion techniques optimized for Anadarko Basin geology, achieving superior well performance and cost efficiency when compared to regional competitors ▪ Ability to pivot quickly in response to price swings provides Mach an edge over our less agile peers Mid - Continent ~20% Base Decline Rate (1) : ~2.1MM Net Acres: ~6,100 Gross Op. Wells 83 MBOED Q4 2025e Production: ~65% Avg. Operated W.I.: 57% Gas as % of Q4 2025e Production: Mach Mid - Continent Position KEY STATS OK TX KS ~2.1 MILLION NET ACRES Kansas Oklahoma Texas 1) Based on mid - year 2025. 16
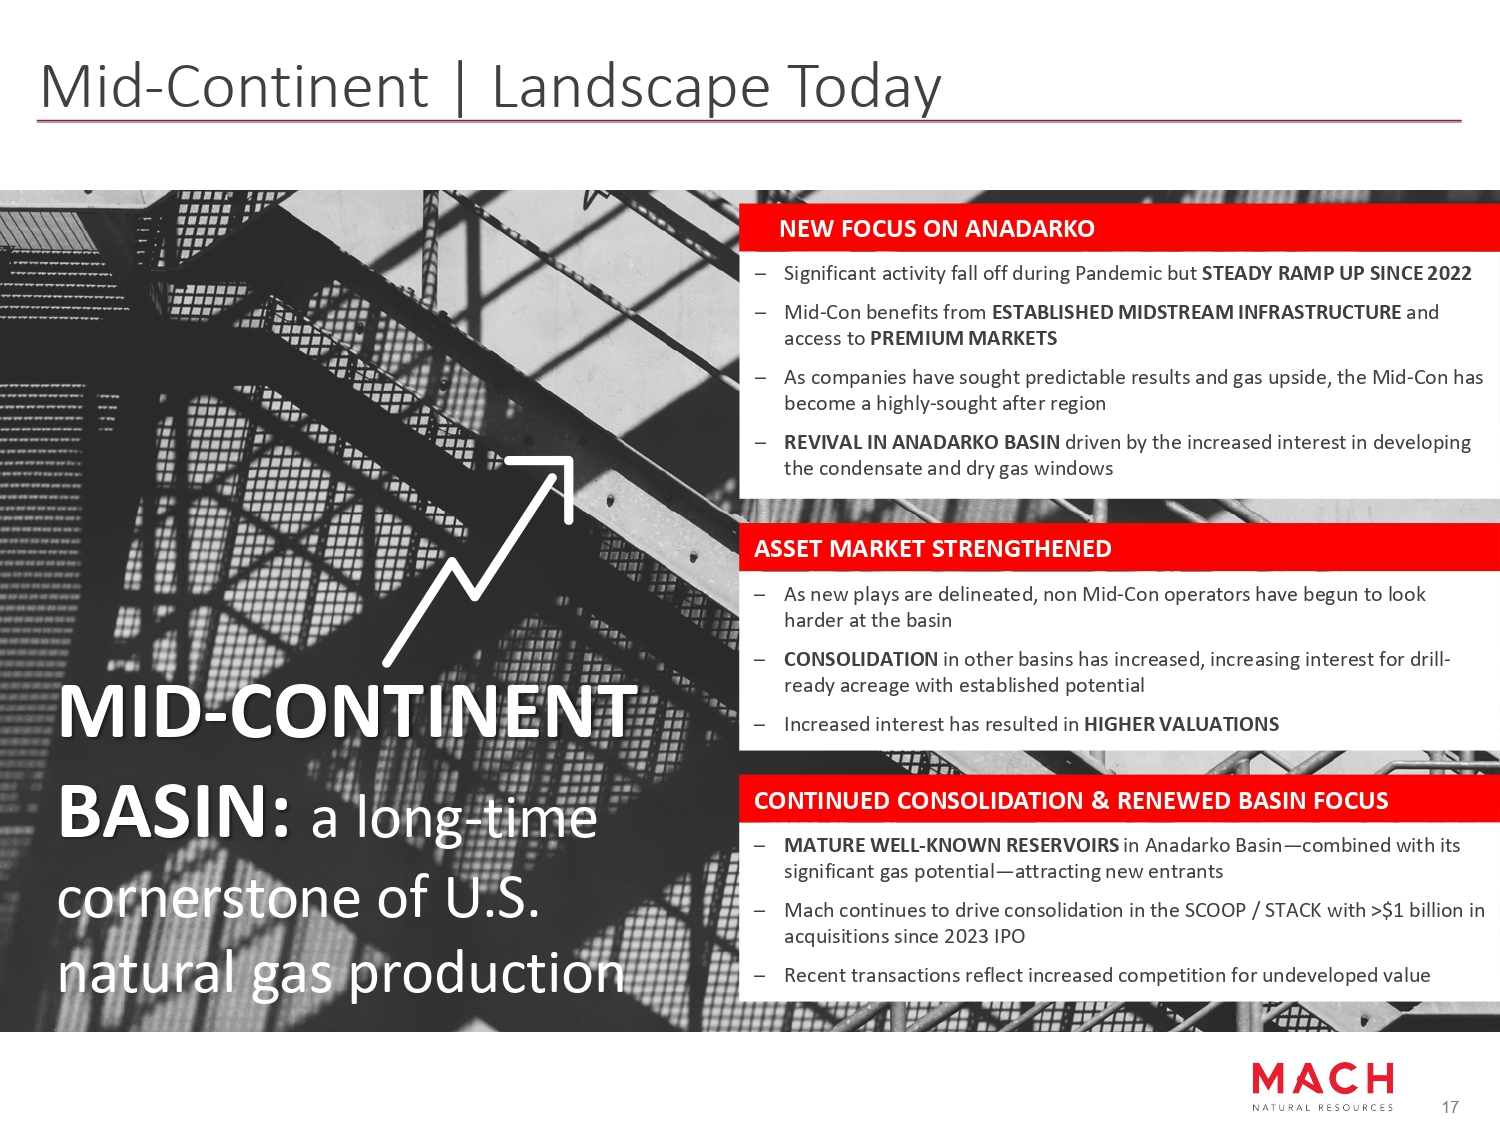
Mid - Continent | Landscape Today MID - CONTINENT BASIN: a long - time cornerstone of U.S. natural gas production NEW FOCUS ON ANADARKO 17 – Significant activity fall off during Pandemic but STEADY RAMP UP SINCE 2022 – Mid - Con benefits from ESTABLISHED MIDSTREAM INFRASTRUCTURE and access to PREMIUM MARKETS – As companies have sought predictable results and gas upside, the Mid - Con has become a highly - sought after region – REVIVAL IN ANADARKO BASIN driven by the increased interest in developing the condensate and dry gas windows CONTINUED CONSOLIDATION & RENEWED BASIN FOCUS – MATURE WELL - KNOWN RESERVOIRS in Anadarko Basin — combined with its significant gas potential — attracting new entrants – Mach continues to drive consolidation in the SCOOP / STACK with >$1 billion in acquisitions since 2023 IPO – Recent transactions reflect increased competition for undeveloped value ASSET MARKET STRENGTHENED – As new plays are delineated, non Mid - Con operators have begun to look harder at the basin – CONSOLIDATION in other basins has increased, increasing interest for drill - ready acreage with established potential – Increased interest has resulted in HIGHER VALUATIONS

Mach Resources. All Rights Reserved. 18 Company Overview
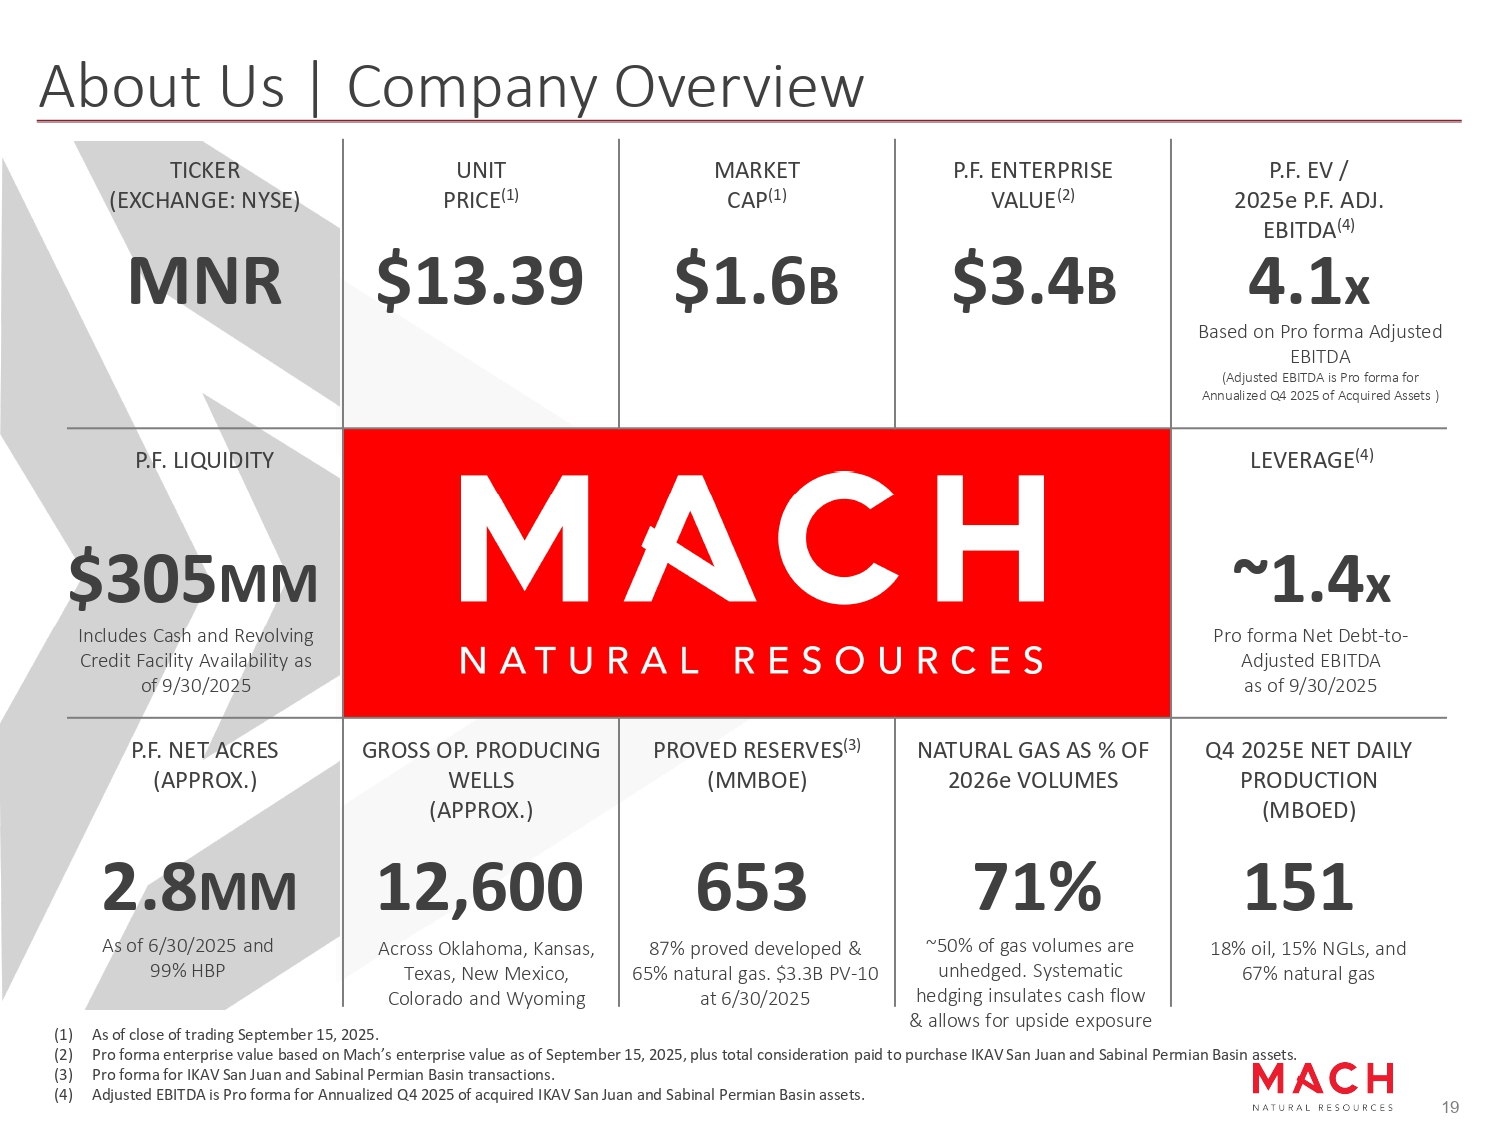
19 About Us | Company Overview & allows for upside exposure (1) As of close of trading September 15, 2025. (2) Pro forma enterprise value based on Mach’s enterprise value as of September 15, 2025, plus total consideration paid to purchase IKAV San Juan and Sabinal Permian Basin assets. (3) Pro forma for IKAV San Juan and Sabinal Permian Basin transactions. (4) Adjusted EBITDA is Pro forma for Annualized Q4 2025 of acquired IKAV San Juan and Sabinal Permian Basin assets. P.F. EV / 2025e P.F. ADJ. EBITDA (4) 4.1 x Based on Pro forma Adjusted EBITDA (Adjusted EBITDA is Pro forma for Annualized Q4 2025 of Acquired Assets ) P.F. ENTERPRISE VALUE (2) $3.4 B MARKET CAP (1) $1.6 B UNIT PRICE (1) $13.39 TICKER (EXCHANGE: NYSE) MNR LEVERAGE (4) ~1.4 x Pro forma Net Debt - to - Adjusted EBITDA as of 9/30/2025 P.F. LIQUIDITY $305 MM Includes Cash and Revolving Credit Facility Availability as of 9/30/2025 Q4 2025E NET DAILY PRODUCTION (MBOED) NATURAL GAS AS % OF 2026e VOLUMES PROVED RESERVES (3) (MMBOE) GROSS OP. PRODUCING WELLS (APPROX.) P.F. NET ACRES (APPROX.) 151 18% oil, 15% NGLs, and 67% natural gas 71% ~50% of gas volumes are unhedged. Systematic hedging insulates cash flow 653 87% proved developed & 65% natural gas. $3.3B PV - 10 at 6/30/2025 12,600 Across Oklahoma, Kansas, Texas, New Mexico, Colorado and Wyoming 2.8 MM As of 6/30/2025 and 99% HBP
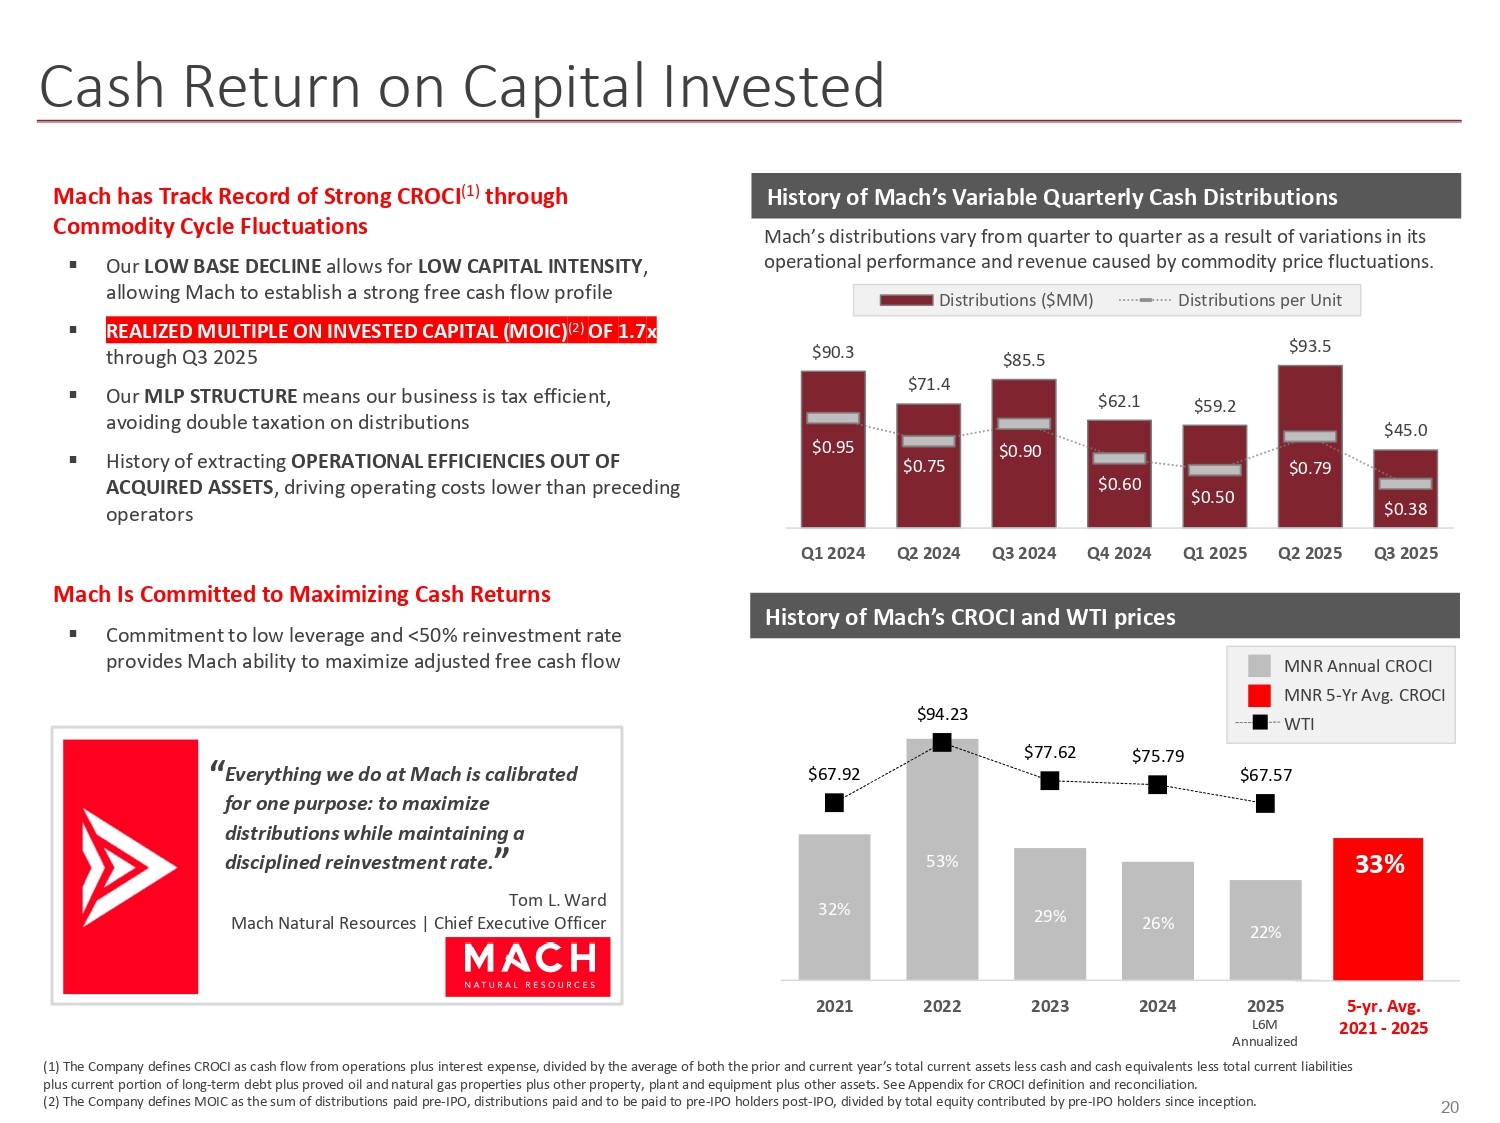
20 Cash Return on Capital Invested 32% 53% 29% 26% 22% $67.92 $94.23 $77.62 $75.79 $67.57 2021 2022 2023 2024 2025 L6M Annualized Mach has Track Record of Strong CROCI (1) through Commodity Cycle Fluctuations ▪ Our LOW BASE DECLINE allows for LOW CAPITAL INTENSITY , allowing Mach to establish a strong free cash flow profile ▪ REALIZED MULTIPLE ON INVESTED CAPITAL (MOIC) (2) OF 1.7x through Q3 2025 ▪ Our MLP STRUCTURE means our business is tax efficient, avoiding double taxation on distributions ▪ History of extracting OPERATIONAL EFFICIENCIES OUT OF ACQUIRED ASSETS , driving operating costs lower than preceding operators Mach Is Committed to Maximizing Cash Returns ▪ Commitment to low leverage and <50% reinvestment rate provides Mach ability to maximize adjusted free cash flow 5 - yr. Avg. 2021 - 2025 33% MNR Annual CROCI MNR 5 - Yr Avg. CROCI WTI $90.3 $71.4 $85.5 $62.1 $59.2 $93.5 $45.0 $0.95 $0.75 $0.90 $0.60 $0.50 $0.79 $0.38 Q1 2024 Q2 2024 Q3 2024 Q4 2024 Q1 2025 Q2 2025 Q3 2025 Distributions ($MM) Distributions per Unit (1) The Company defines CROCI as cash flow from operations plus interest expense, divided by the average of both the prior and current year’s total current assets less cash and cash equivalents less total current liabilities plus current portion of long - term debt plus proved oil and natural gas properties plus other property, plant and equipment plus other assets. See Appendix for CROCI definition and reconciliation. (2) The Company defines MOIC as the sum of distributions paid pre - IPO, distributions paid and to be paid to pre - IPO holders post - IPO, divided by total equity contributed by pre - IPO holders since inception. History of Mach’s Variable Quarterly Cash Distributions History of Mach’s CROCI and WTI prices Mach’s distributions vary from quarter to quarter as a result of variations in its operational performance and revenue caused by commodity price fluctuations. “ Everything we do at Mach is calibrated for one purpose: to maximize distributions while maintaining a disciplined reinvestment rate. ” Tom L. Ward Mach Natural Resources | Chief Executive Officer
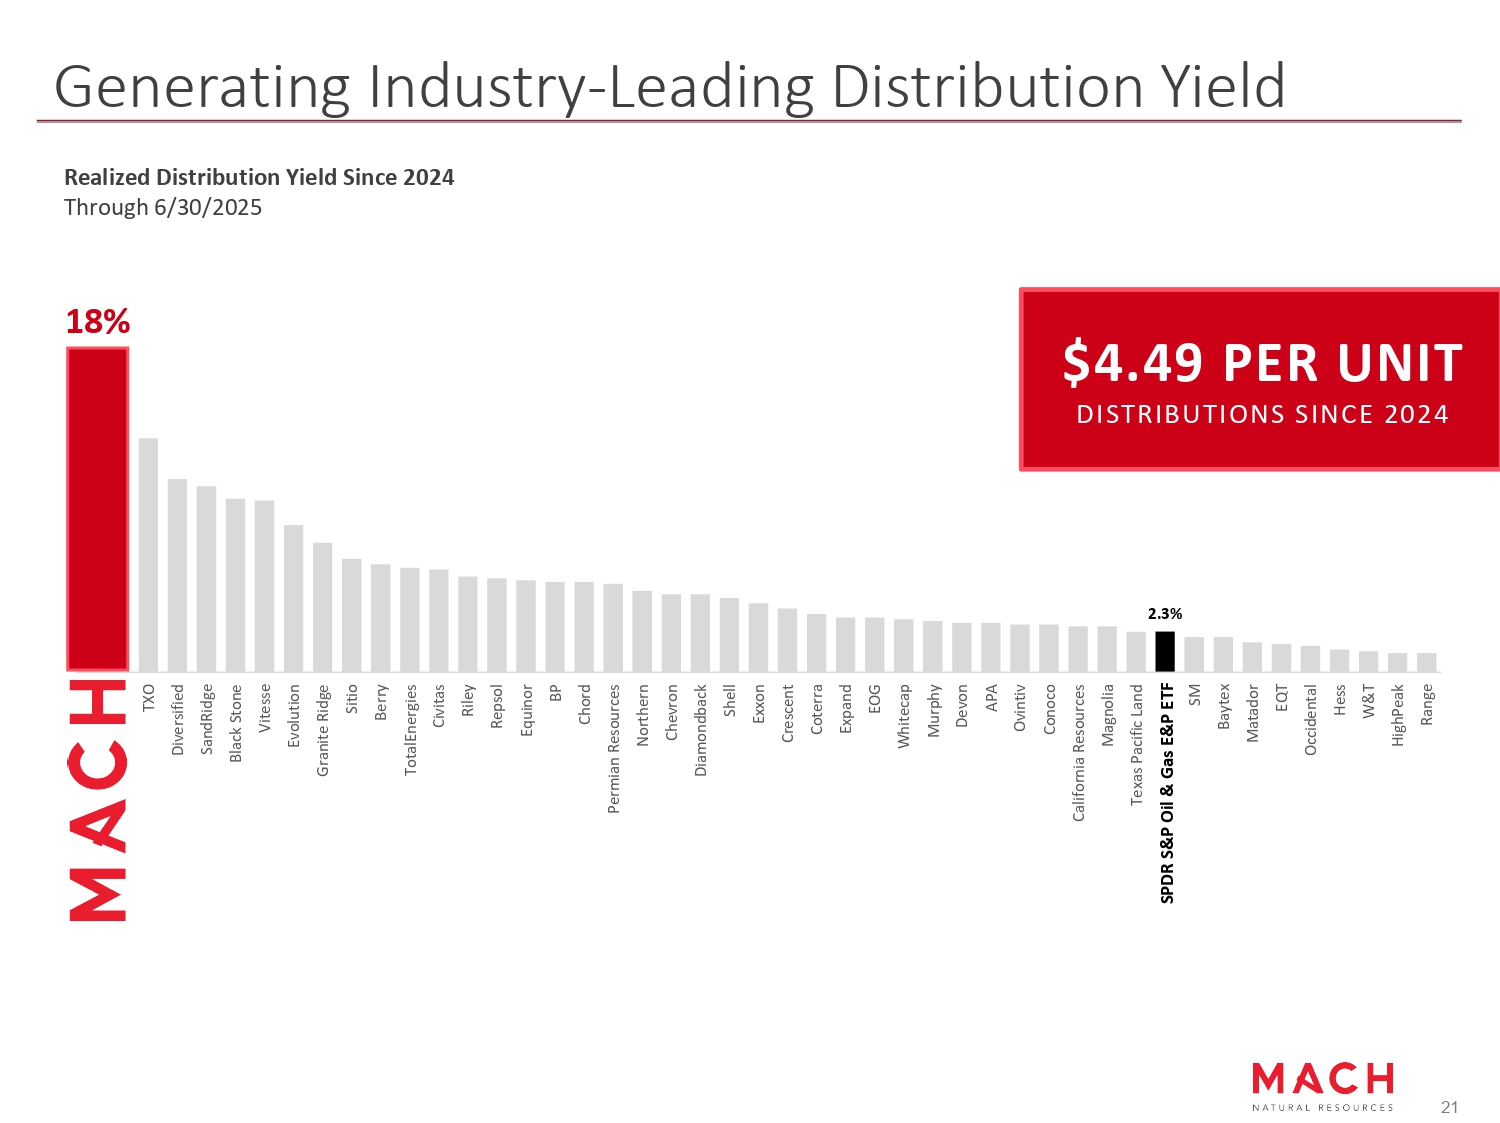
2.3% Mach SPDR S&P Oil & Gas E&P ETF Realized Distribution Yield Since 2024 Through 6/30/2025 Generating Industry - Leading Distribution Yield $4.49 PER UNIT DISTRIBUTIONS SINCE 2024 TXO Diversified SandRidge Black Stone Vitesse Evolution Granite Ridge Sitio Berry TotalEnergies Civitas Riley Repsol Equinor BP Chord Permian Resources Northern Chevron Diamondback Shell Exxon Crescent Coterra Expand EOG Whitecap Murphy Devon APA Ovintiv Conoco California Resources Magnolia Texas Pacific Land SPDR S&P Oil & Gas E&P ETF SM Baytex Matador EQT Occidental Hess W&T HighPeak Range 21 18%
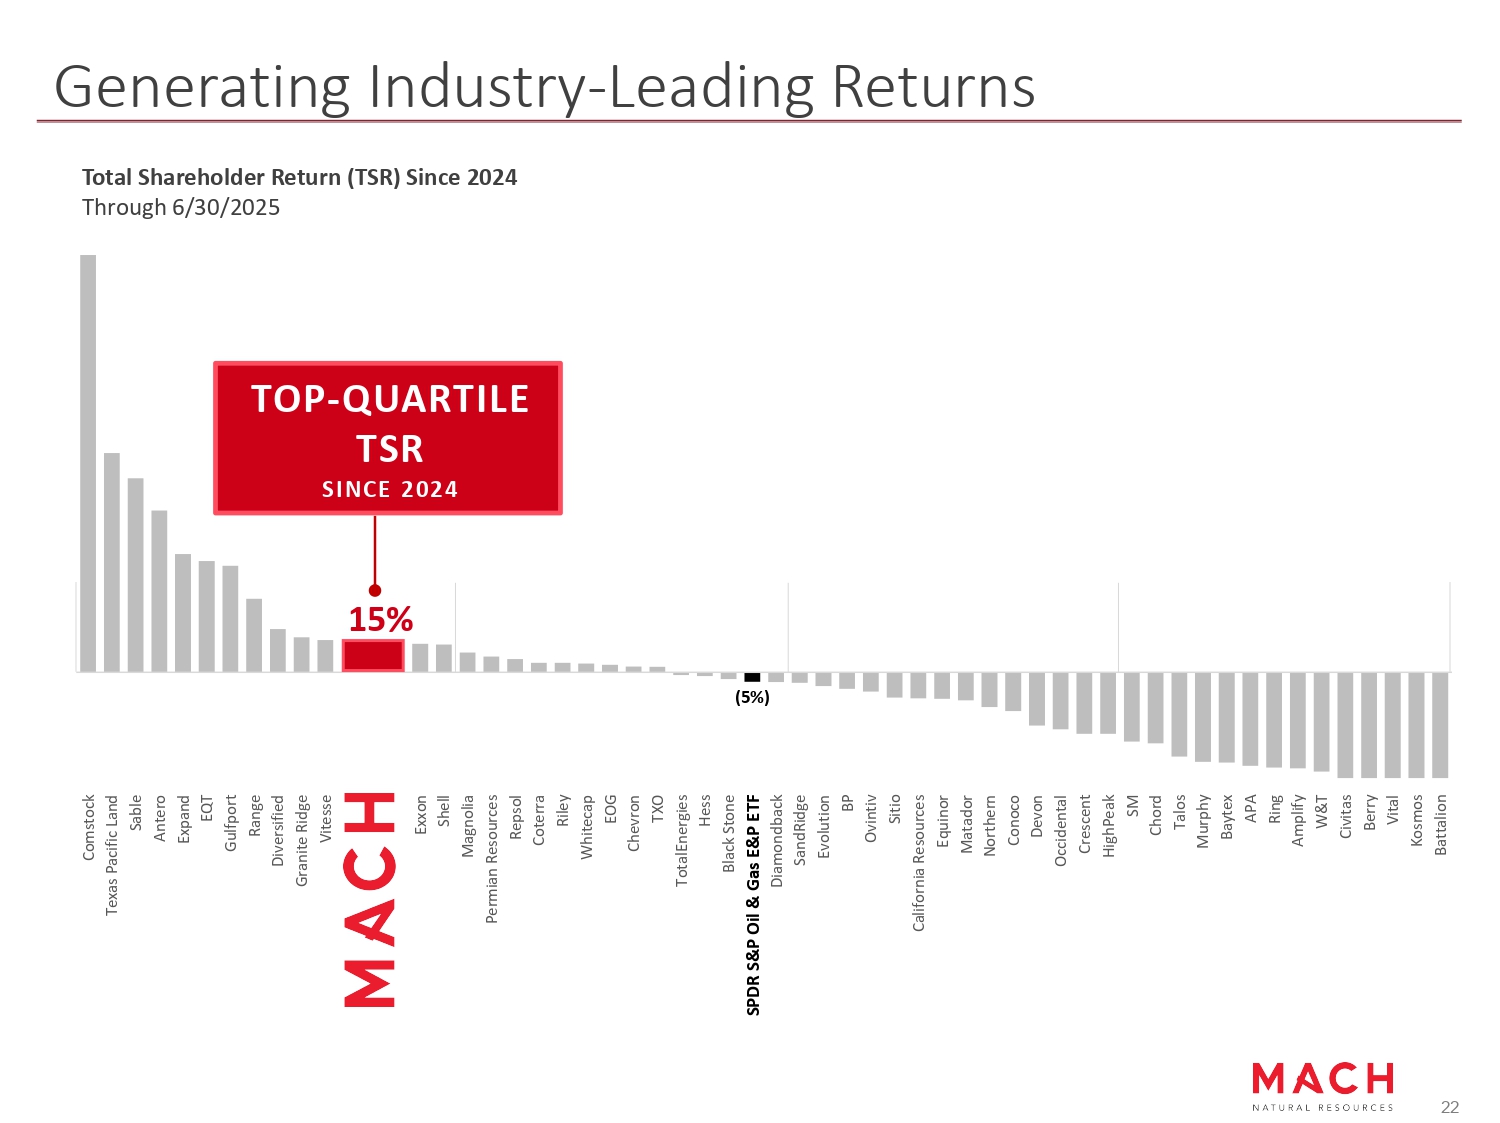
Generating Industry - Leading Returns Total Shareholder Return (TSR) Since 2024 Through 6/30/2025 Comstock Texas Pacific Land Sable Antero Expand EQT Gulfport Range Diversified Granite Ridge Vitesse Mach SPDR S&P Oil & Gas E &P ETF (5%) 15% Exxon Shell Magnolia Permian Resources Repsol Coterra Riley Whitecap EOG Chevron TXO TotalEnergies Hess Black Stone SPDR S&P Oil & Gas E&P ETF Diamondback SandRidge Evolution BP Ovintiv Sitio California Resources Equinor Matador Northern Conoco Devon Occidental Crescent HighPeak SM Chord Talos Murphy Baytex APA Ring Amplify W&T Civitas Berry Vital Kosmos Battalion TOP - QUARTILE TSR SINCE 2024 22
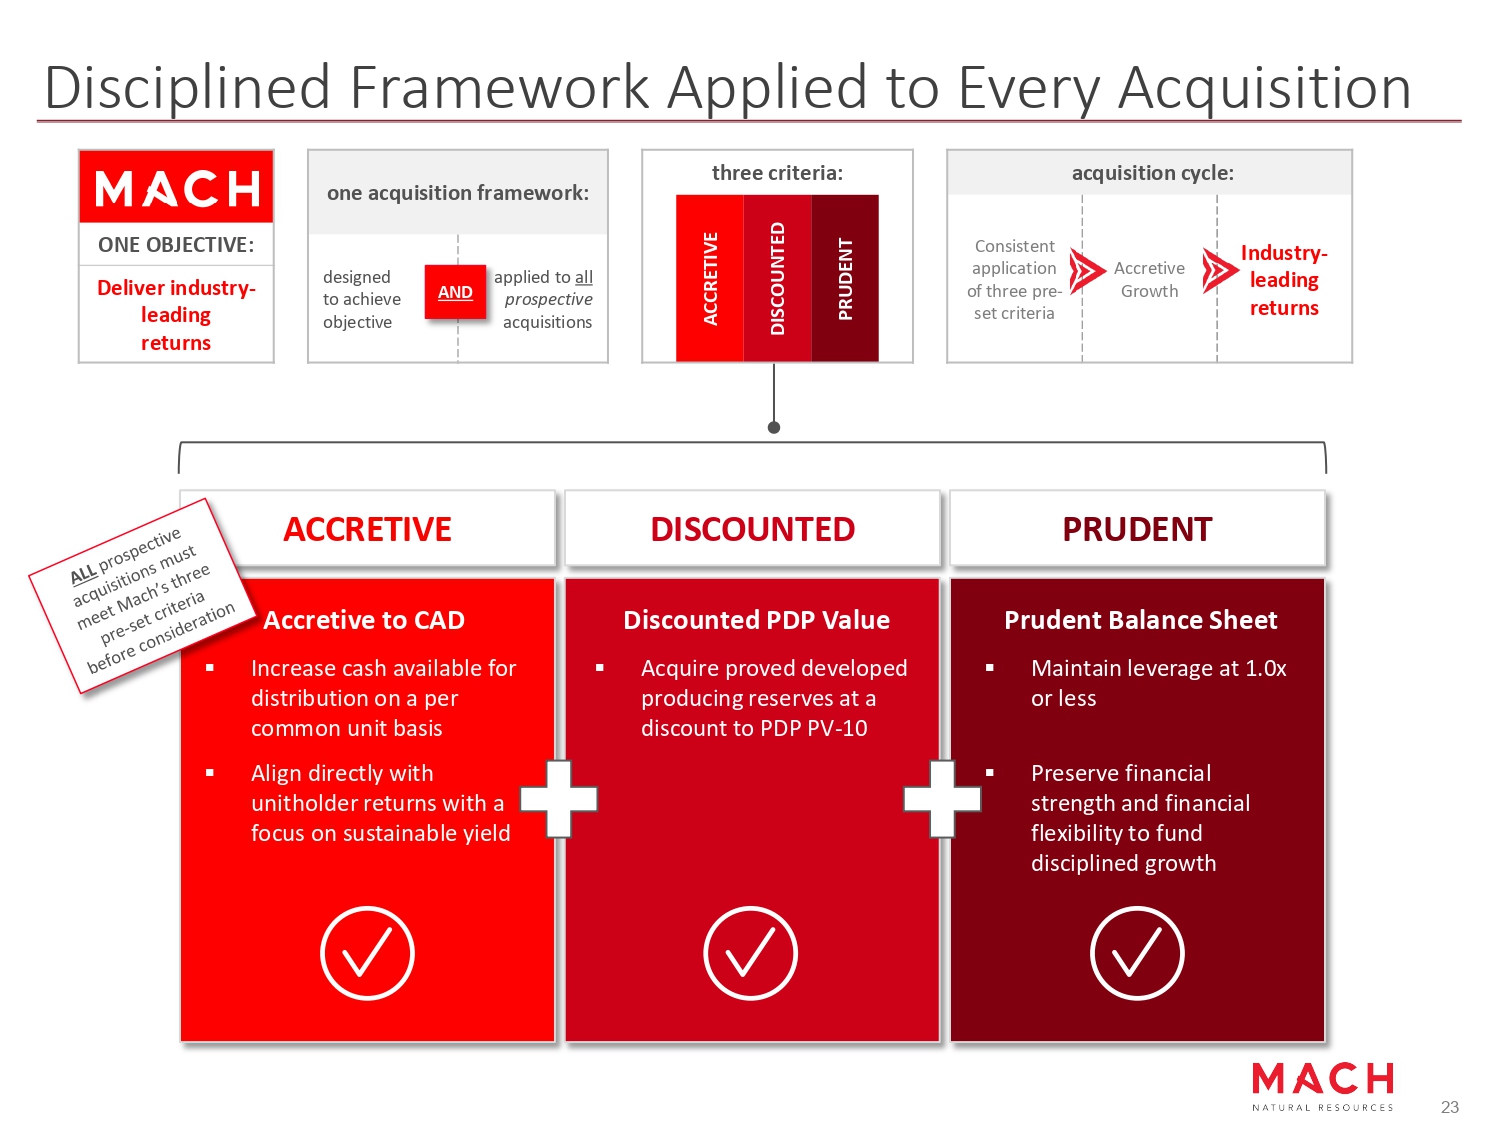
acquisition cycle: Industry - leading returns Accretive Growth Consistent application of three pre - set criteria three criteria: ACCRETIVE DISCOUNTED PRUDENT ONE OBJECTIVE: Deliver industry - leading returns Disciplined Framework Applied to Every Acquisition ACCRETIVE DISCOUNTED PRUDENT Discounted PDP Value ▪ Acquire proved developed producing reserves at a discount to PDP PV - 10 Prudent Balance Sheet ▪ Maintain leverage at 1.0x or less Accretive to CAD ▪ Increase cash available for distribution on a per common unit basis ▪ Align directly with unitholder returns with a focus on sustainable yield ▪ Preserve financial strength and financial flexibility to fund disciplined growth one acquisition framework: designed applied to all to achieve AND prospective acquisitions objective 23
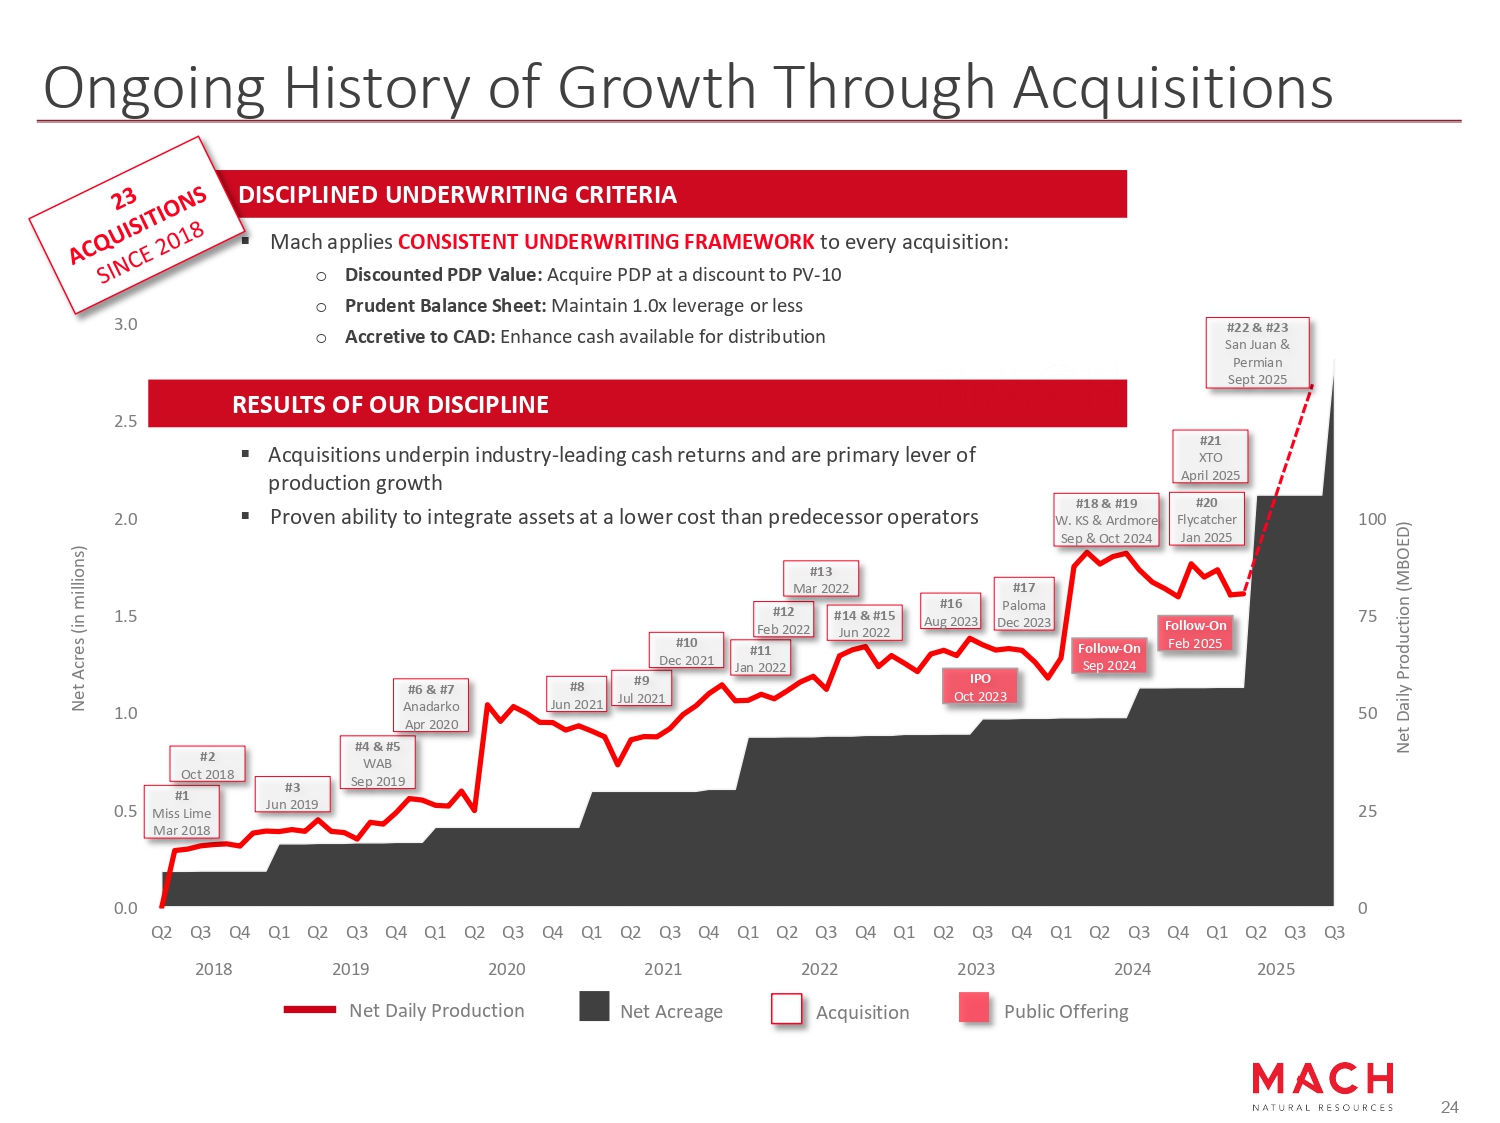
Ongoing History of Growth Through Acquisitions 0.0 0.5 1.0 1.5 2.0 2.5 3.0 Q2 Q3 Q4 Q1 Q2 Q3 Q4 Q1 Q2 Q3 Q4 Q1 Q2 Q3 Q4 Q1 Q2 Q3 Q4 Q1 Q2 Q3 Q4 Q1 Q2 Q3 Q4 Q1 Q2 Q3 Q3 2018 2019 2020 Net Daily Production 2021 2022 2023 2024 2025 0 25 50 75 100 150 125 Net Acreage Net Daily Production (MBOED) Net Acres (in millions) #3 Jun 2019 #4 & #5 WAB Sep 2019 #6 & #7 Anadarko Apr 2020 #8 Jun 2021 #1 Miss Lime Mar 2018 #2 Oct 2018 #9 Jul 2021 #10 Dec 2021 #11 Jan 2022 #12 Feb 2022 #13 Mar 2022 #14 & #15 Jun 2022 #16 Aug 2023 #17 Paloma Dec 2023 #18 & #19 W. KS & Ardmore Sep & Oct 2024 #20 Flycatcher Jan 2025 #21 XTO April 2025 Acquisition Public Offering IPO Oct 2023 Follow - On Sep 2024 Follow - On Feb 2025 #22 & #23 San Juan & Permian Sept 2025 DISCIPLINED UNDERWRITING CRITERIA ▪ Mach applies CONSISTENT UNDERWRITING FRAMEWORK to every acquisition: o Discounted PDP Value: Acquire PDP at a discount to PV - 10 o Prudent Balance Sheet: Maintain 1.0x leverage or less o Accretive to CAD: Enhance cash available for distribution RESULTS OF OUR DISCIPLINE 24 ▪ Acquisitions underpin industry - leading cash returns and are primary lever of production growth ▪ Proven ability to integrate assets at a lower cost than predecessor operators

Mach Resources. All Rights Reserved. 25 Appendix
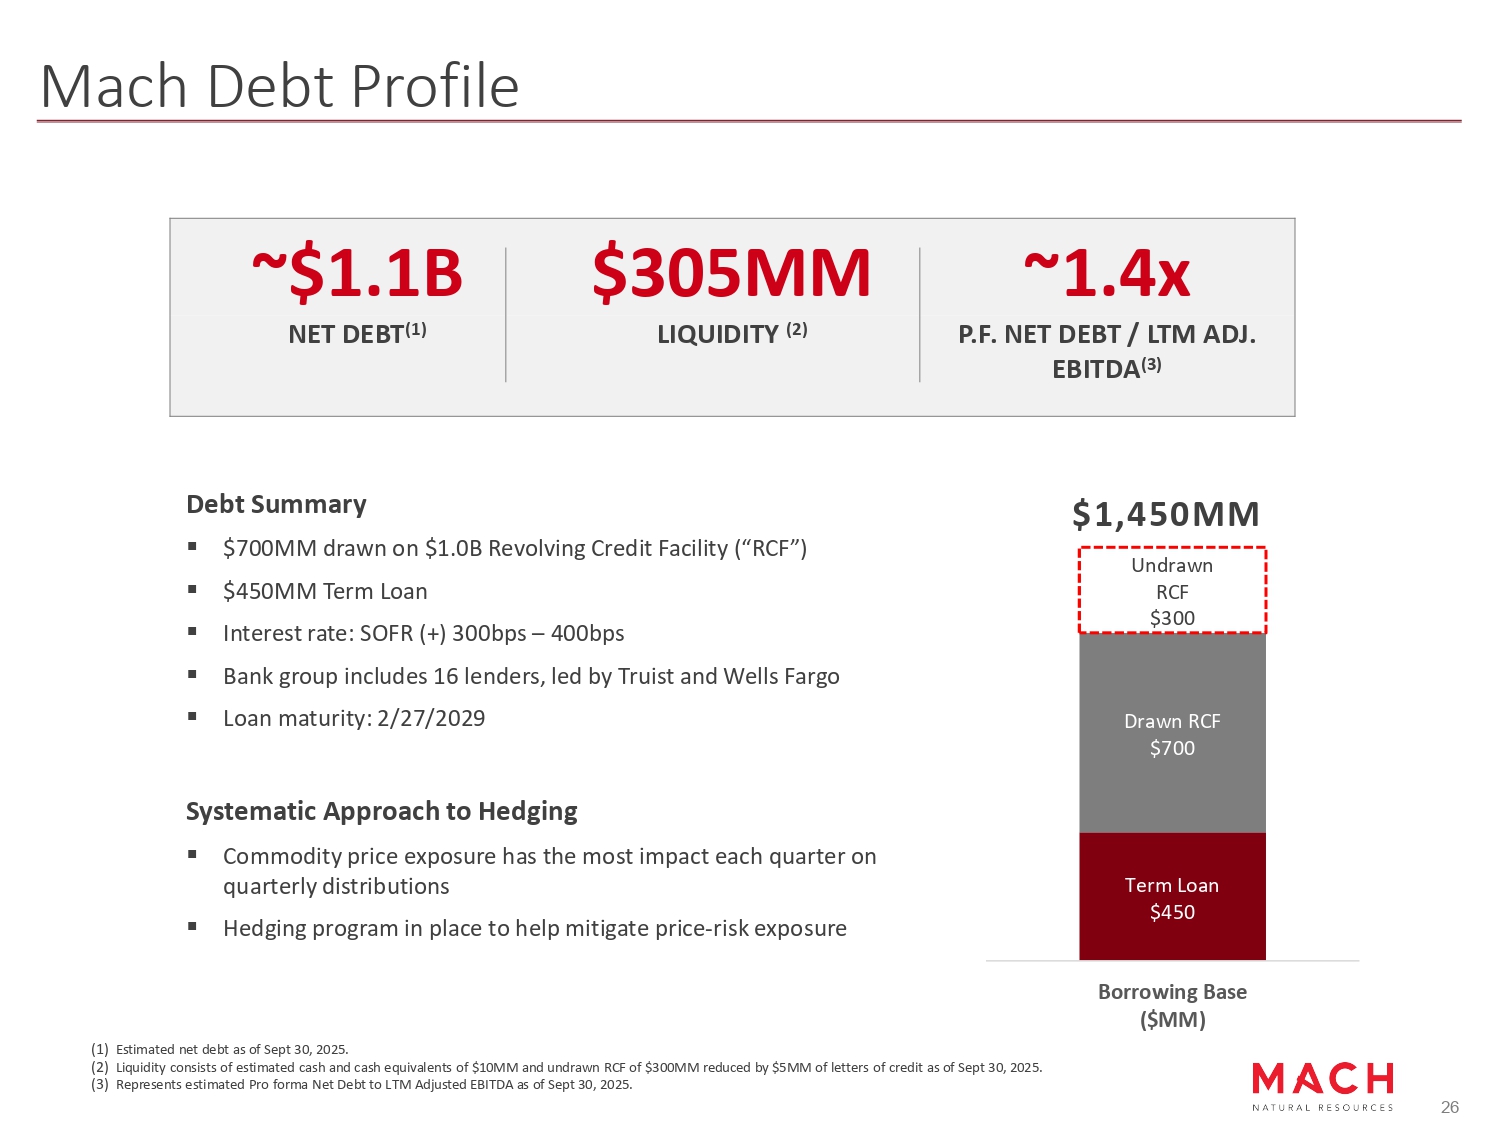
Mach Debt Profile Debt Summary ▪ $700MM drawn on $1.0B Revolving Credit Facility (“RCF”) ▪ $450MM Term Loan ▪ Interest rate: SOFR (+) 300bps – 400bps ▪ Bank group includes 16 lenders, led by Truist and Wells Fargo ▪ Loan maturity: 2/27/2029 Systematic Approach to Hedging ▪ Commodity price exposure has the most impact each quarter on quarterly distributions ▪ Hedging program in place to help mitigate price - risk exposure ~1.4x $305MM ~$1.1B P.F. NET DEBT / LTM ADJ. EBITDA (3) LIQUIDITY (2) NET DEBT (1) (1) Estimated net debt as of Sept 30, 2025. (2) Liquidity consists of estimated cash and cash equivalents of $10MM and undrawn RCF of $300MM reduced by $5MM of letters of credit as of Sept 30, 2025. (3) Represents estimated Pro forma Net Debt to LTM Adjusted EBITDA as of Sept 30, 2025. Term Loan $450 26 Drawn RCF $700 $1,450MM Undrawn RCF $300 Borrowing Base ($MM)
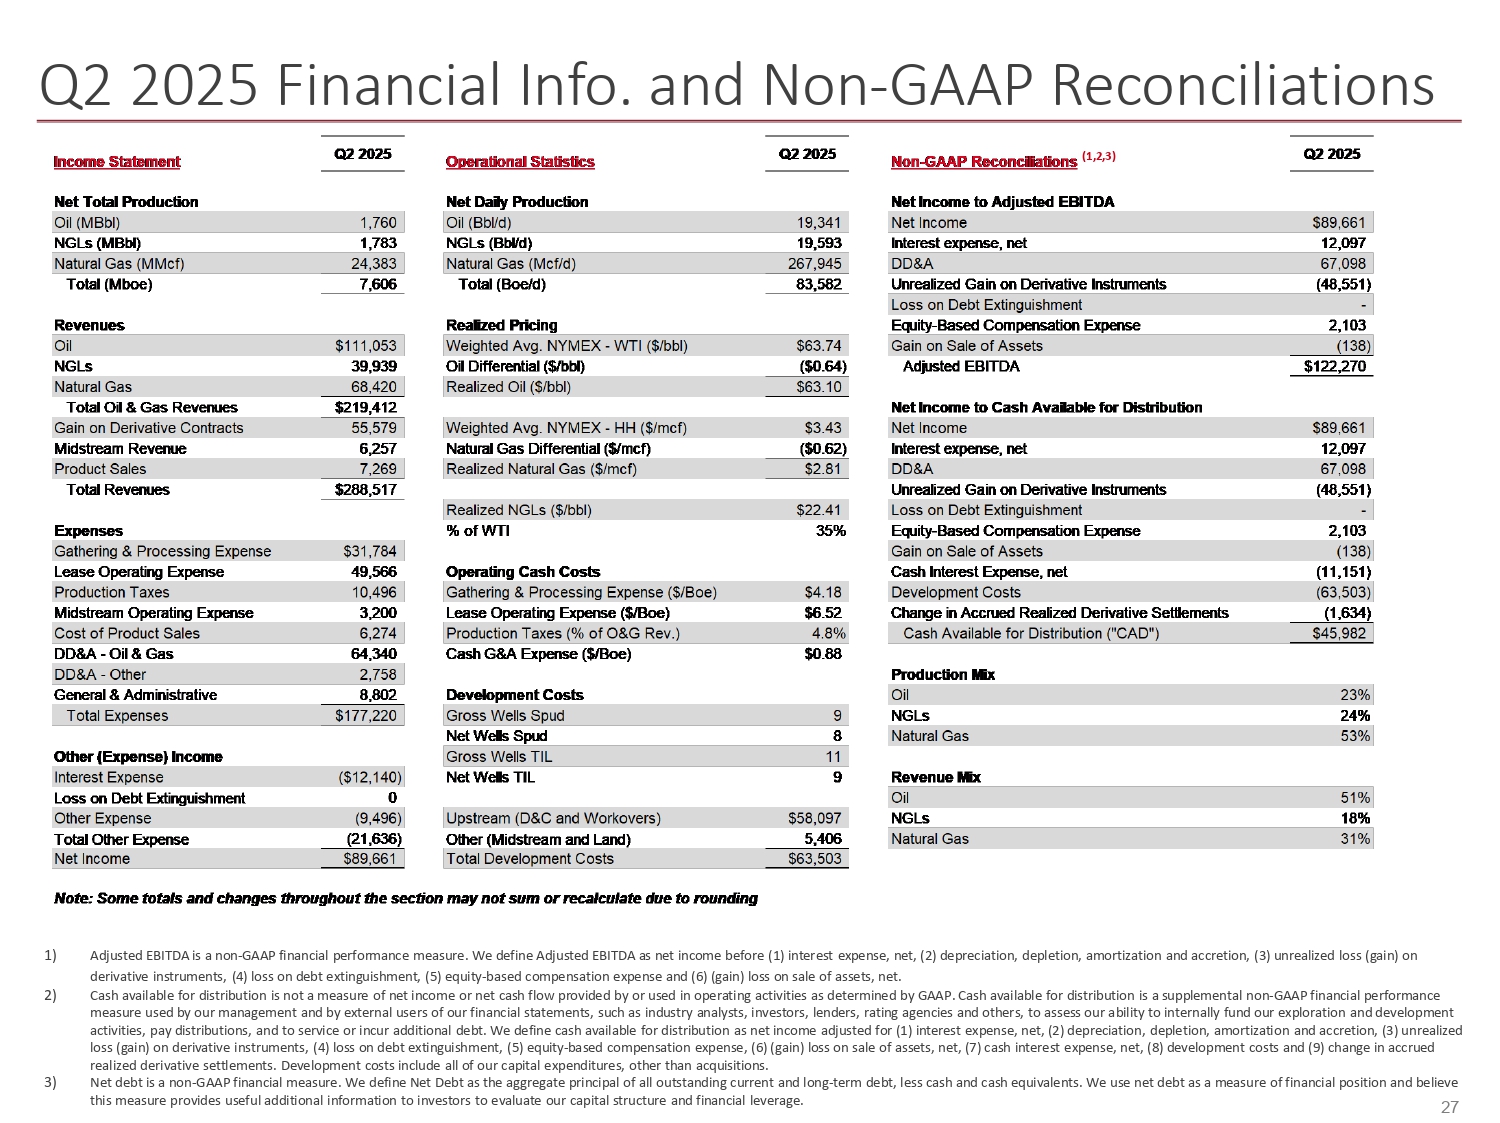
27 Q2 2025 Financial Info. and Non - GAAP Reconciliations (1,2,3) 1) Adjusted EBITDA is a non - GAAP financial performance measure. We define Adjusted EBITDA as net income before (1) interest expense, net, (2) depreciation, depletion, amortization and accretion, (3) unrealized loss (gain) on derivative instruments, (4) loss on debt extinguishment, (5) equity - based compensation expense and (6) (gain) loss on sale of assets, net. 2) Cash available for distribution is not a measure of net income or net cash flow provided by or used in operating activities as determined by GAAP. Cash available for distribution is a supplemental non - GAAP financial performance measure used by our management and by external users of our financial statements, such as industry analysts, investors, lenders, rating agencies and others, to assess our ability to internally fund our exploration and development activities, pay distributions, and to service or incur additional debt. We define cash available for distribution as net income adjusted for (1) interest expense, net, (2) depreciation, depletion, amortization and accretion, (3) unrealized loss (gain) on derivative instruments, (4) loss on debt extinguishment, (5) equity - based compensation expense, (6) (gain) loss on sale of assets, net, (7) cash interest expense, net, (8) development costs and (9) change in accrued realized derivative settlements. Development costs include all of our capital expenditures, other than acquisitions. 3) Net debt is a non - GAAP financial measure. We define Net Debt as the aggregate principal of all outstanding current and long - term debt, less cash and cash equivalents. We use net debt as a measure of financial position and believe this measure provides useful additional information to investors to evaluate our capital structure and financial leverage.
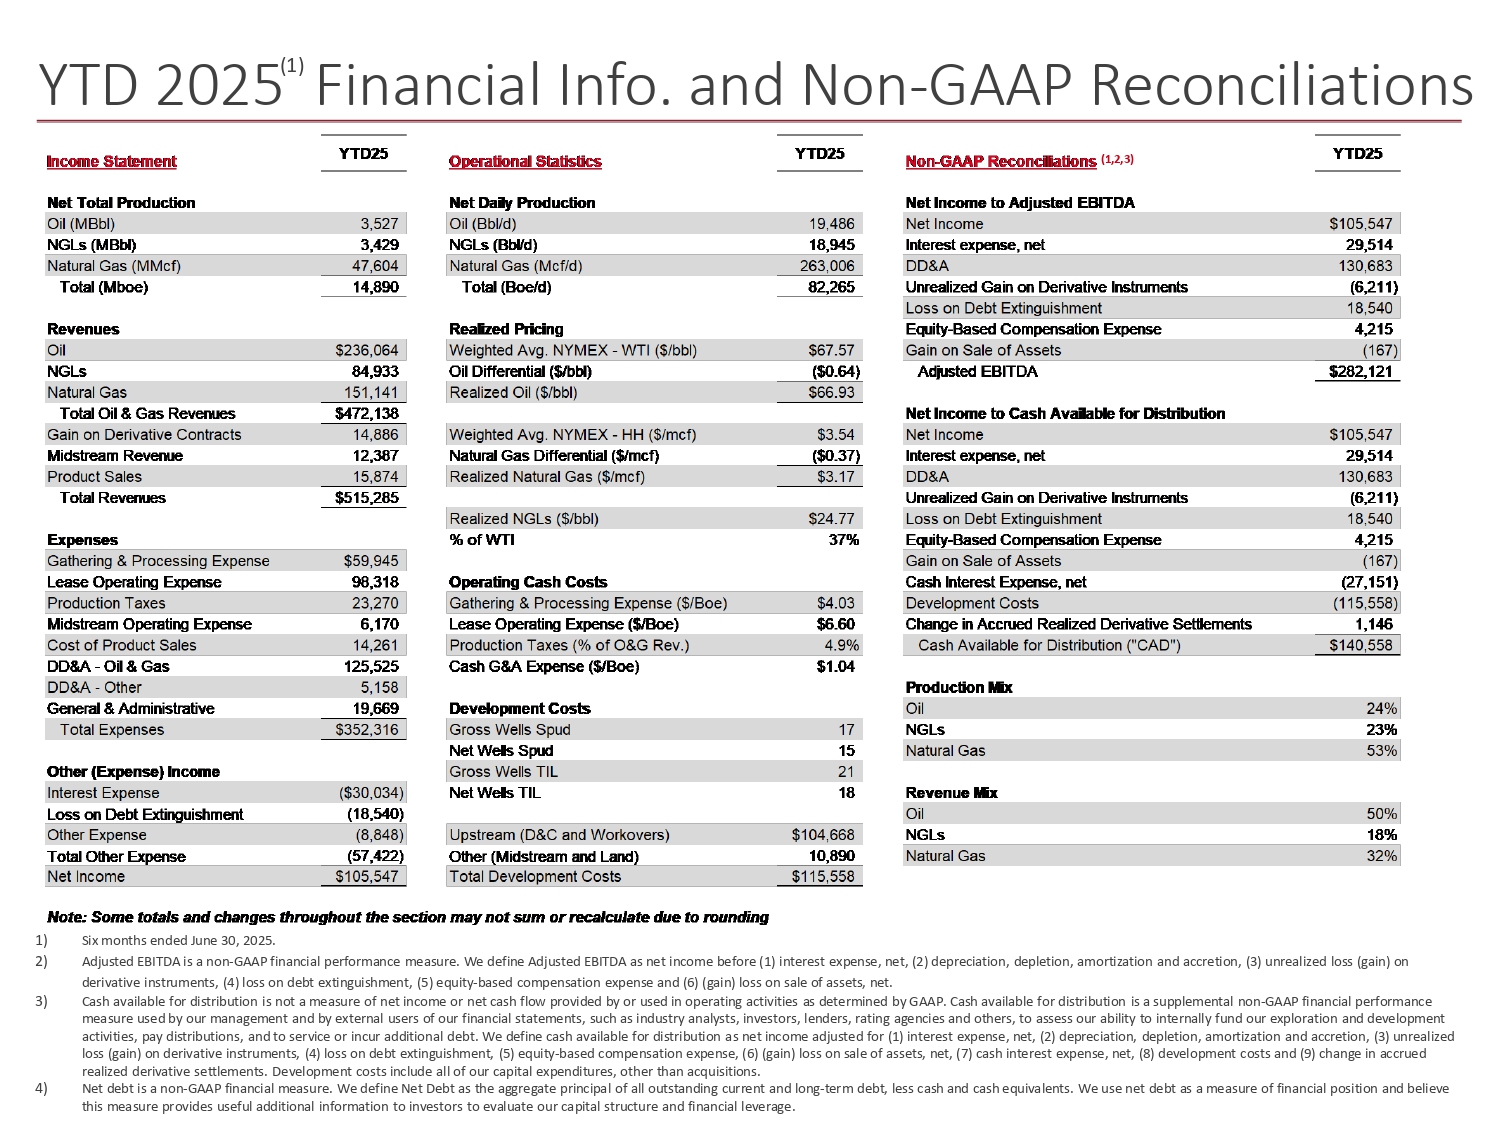
28 YTD 2025 Financial Info. and Non - GAAP Reconciliation s (1,2,3) 1) 2) 3) 4) Six months ended June 30, 2025. Adjusted EBITDA is a non - GAAP financial performance measure. We define Adjusted EBITDA as net income before (1) interest expense, net, (2) depreciation, depletion, amortization and accretion, (3) unrealized loss (gain) on derivative instruments, (4) loss on debt extinguishment, (5) equity - based compensation expense and (6) (gain) loss on sale of assets, net. Cash available for distribution is not a measure of net income or net cash flow provided by or used in operating activities as determined by GAAP. Cash available for distribution is a supplemental non - GAAP financial performance measure used by our management and by external users of our financial statements, such as industry analysts, investors, lenders, rating agencies and others, to assess our ability to internally fund our exploration and development activities, pay distributions, and to service or incur additional debt. We define cash available for distribution as net income adjusted for (1) interest expense, net, (2) depreciation, depletion, amortization and accretion, (3) unrealized loss (gain) on derivative instruments, (4) loss on debt extinguishment, (5) equity - based compensation expense, (6) (gain) loss on sale of assets, net, (7) cash interest expense, net, (8) development costs and (9) change in accrued realized derivative settlements. Development costs include all of our capital expenditures, other than acquisitions. Net debt is a non - GAAP financial measure. We define Net Debt as the aggregate principal of all outstanding current and long - term debt, less cash and cash equivalents. We use net debt as a measure of financial position and believe this measure provides useful additional information to investors to evaluate our capital structure and financial leverage. (1)
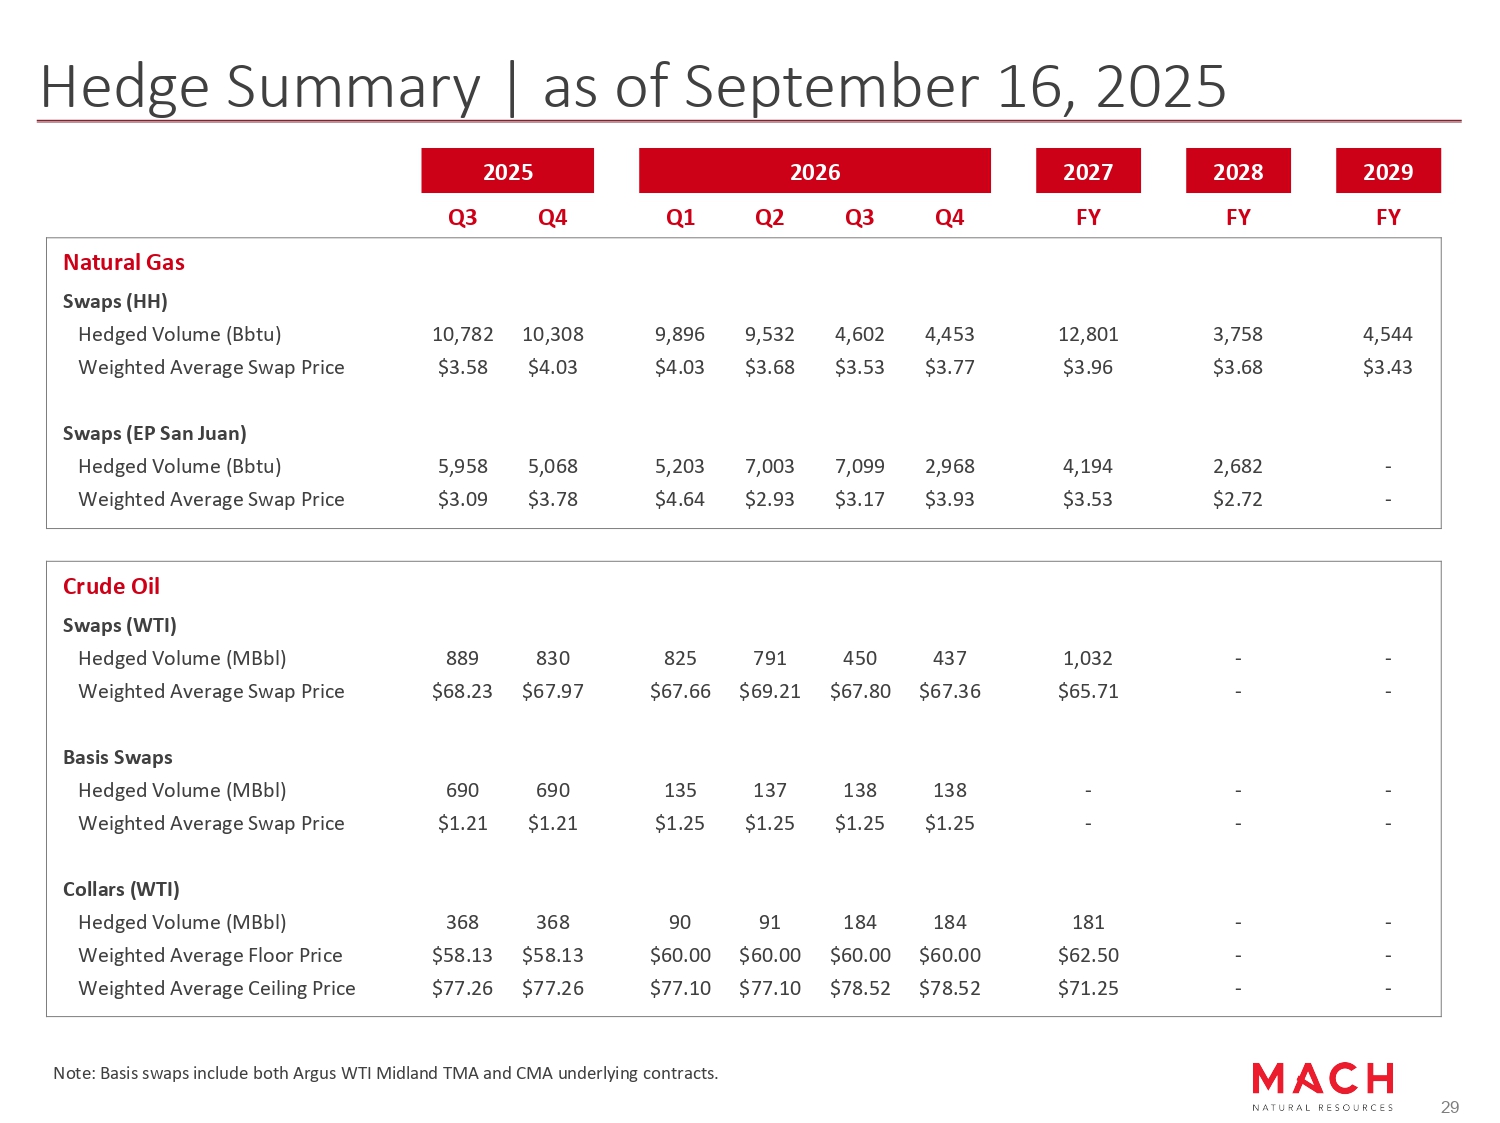
Hedge Summary | as of September 16, 2025 29 2029 2028 2027 2026 2025 FY FY FY Q4 Q3 Q2 Q1 Q4 Q3 Natural Gas Swaps (HH) 4,544 3,758 12,801 4,453 4,602 9,532 9,896 10,308 10,782 Hedged Volume (Bbtu) $3.43 $3.68 $3.96 $3.77 $3.53 $3.68 $4.03 $4.03 $3.58 Weighted Average Swap Price Swaps (EP San Juan) - 2,682 4,194 2,968 7,099 7,003 5,203 5,068 5,958 Hedged Volume (Bbtu) - $2.72 $3.53 $3.93 $3.17 $2.93 $4.64 $3.78 $3.09 Weighted Average Swap Price Crude Oil Swaps (WTI) - - 1,032 437 450 791 825 830 889 Hedged Volume (MBbl) - - $65.71 $67.36 $67.80 $69.21 $67.66 $67.97 $68.23 Weighted Average Swap Price Basis Swaps - - - 138 138 137 135 690 690 Hedged Volume (MBbl) - - - $1.25 $1.25 $1.25 $1.25 $1.21 $1.21 Weighted Average Swap Price Collars (WTI) - - 181 184 184 91 90 368 368 Hedged Volume (MBbl) - - $62.50 $60.00 $60.00 $60.00 $60.00 $58.13 $58.13 Weighted Average Floor Price - - $71.25 $78.52 $78.52 $77.10 $77.10 $77.26 $77.26 Weighted Average Ceiling Price Note: Basis swaps include both Argus WTI Midland TMA and CMA underlying contracts.
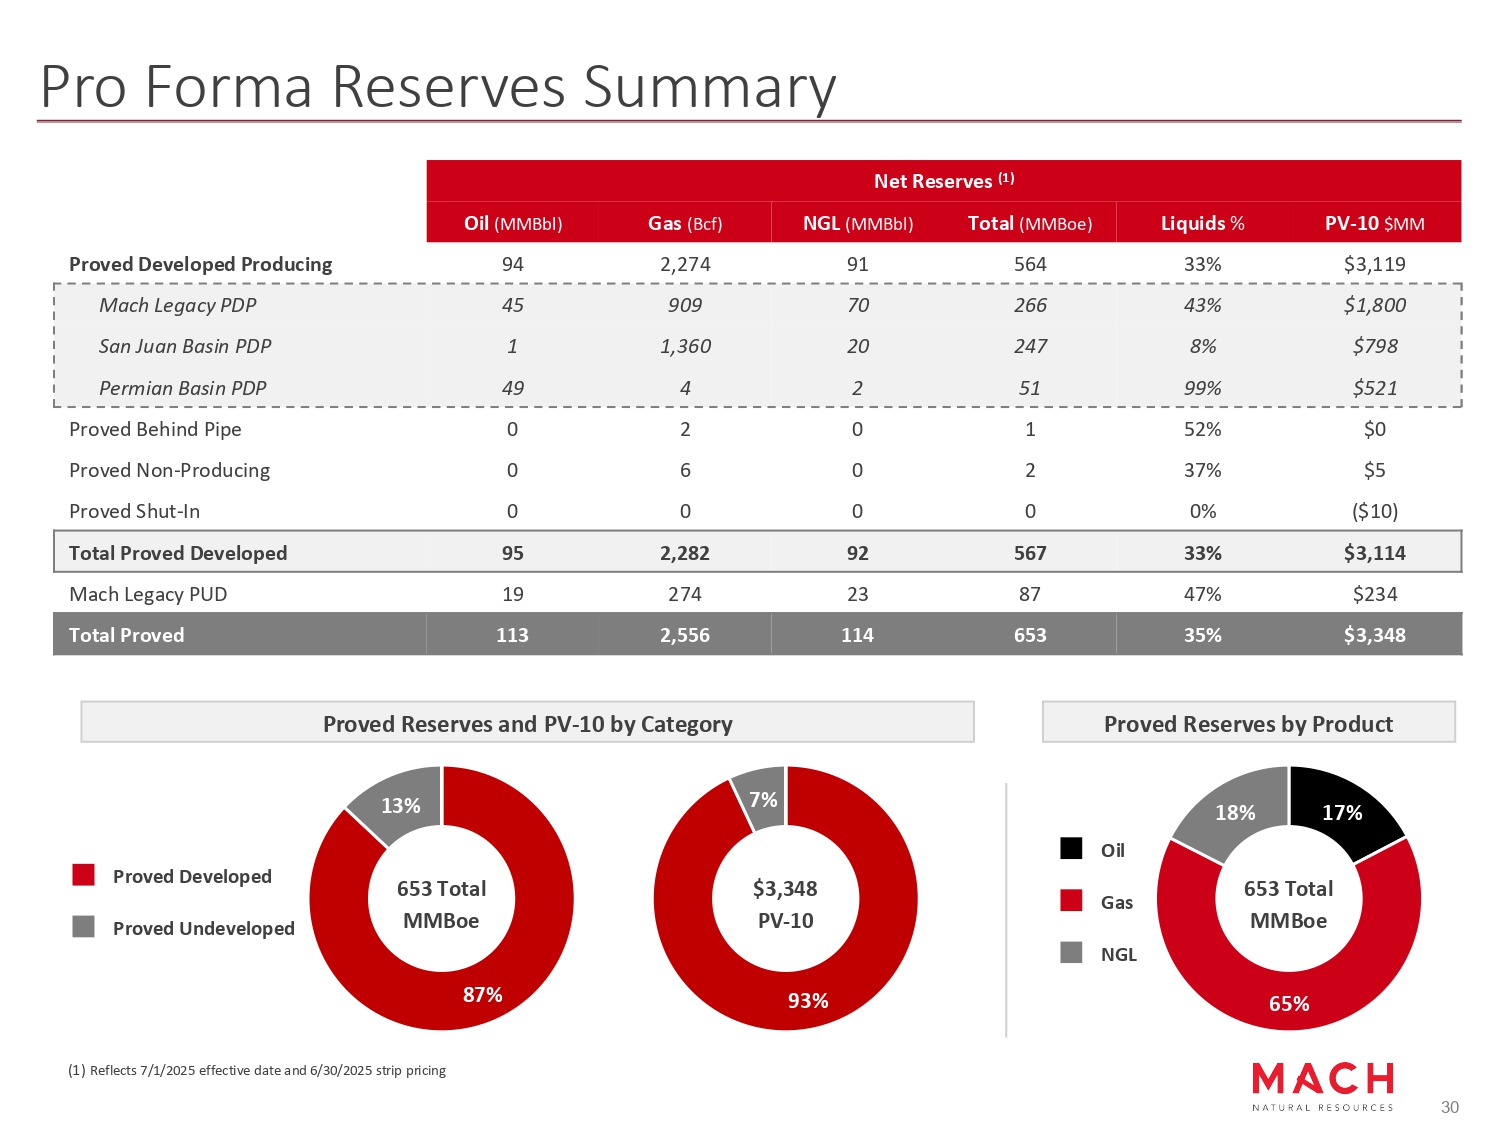
87% 13% 93% 7% 17% 65% 18% Pro Forma Reserves Summary Proved Developed Proved Undeveloped Oil Gas NGL (1) Reflects 7/1/2025 effective date and 6/30/2025 strip pricing (3) 30 Net Reserves (1) PV - 10 $MM Liquids % Total (MMBoe) NGL (MMBbl) Gas (Bcf) Oil (MMBbl) $3,119 33% 564 91 2,274 94 Proved Developed Producing $1,800 43% 266 70 909 45 Mach Legacy PDP $798 8% 247 20 1,360 1 San Juan Basin PDP $521 99% 51 2 4 49 Permian Basin PDP $0 52% 1 0 2 0 Proved Behind Pipe $5 37% 2 0 6 0 Proved Non - Producing ($10) 0% 0 0 0 0 Proved Shut - In $3,114 33% 567 92 2,282 95 Total Proved Developed $234 47% 87 23 274 19 Mach Legacy PUD $3,348 35% 653 114 2,556 113 Total Proved Proved Reserves and PV - 10 by Category Proved Reserves by Product 653 Total MMBoe 653 Total MMBoe $3,348 PV - 10
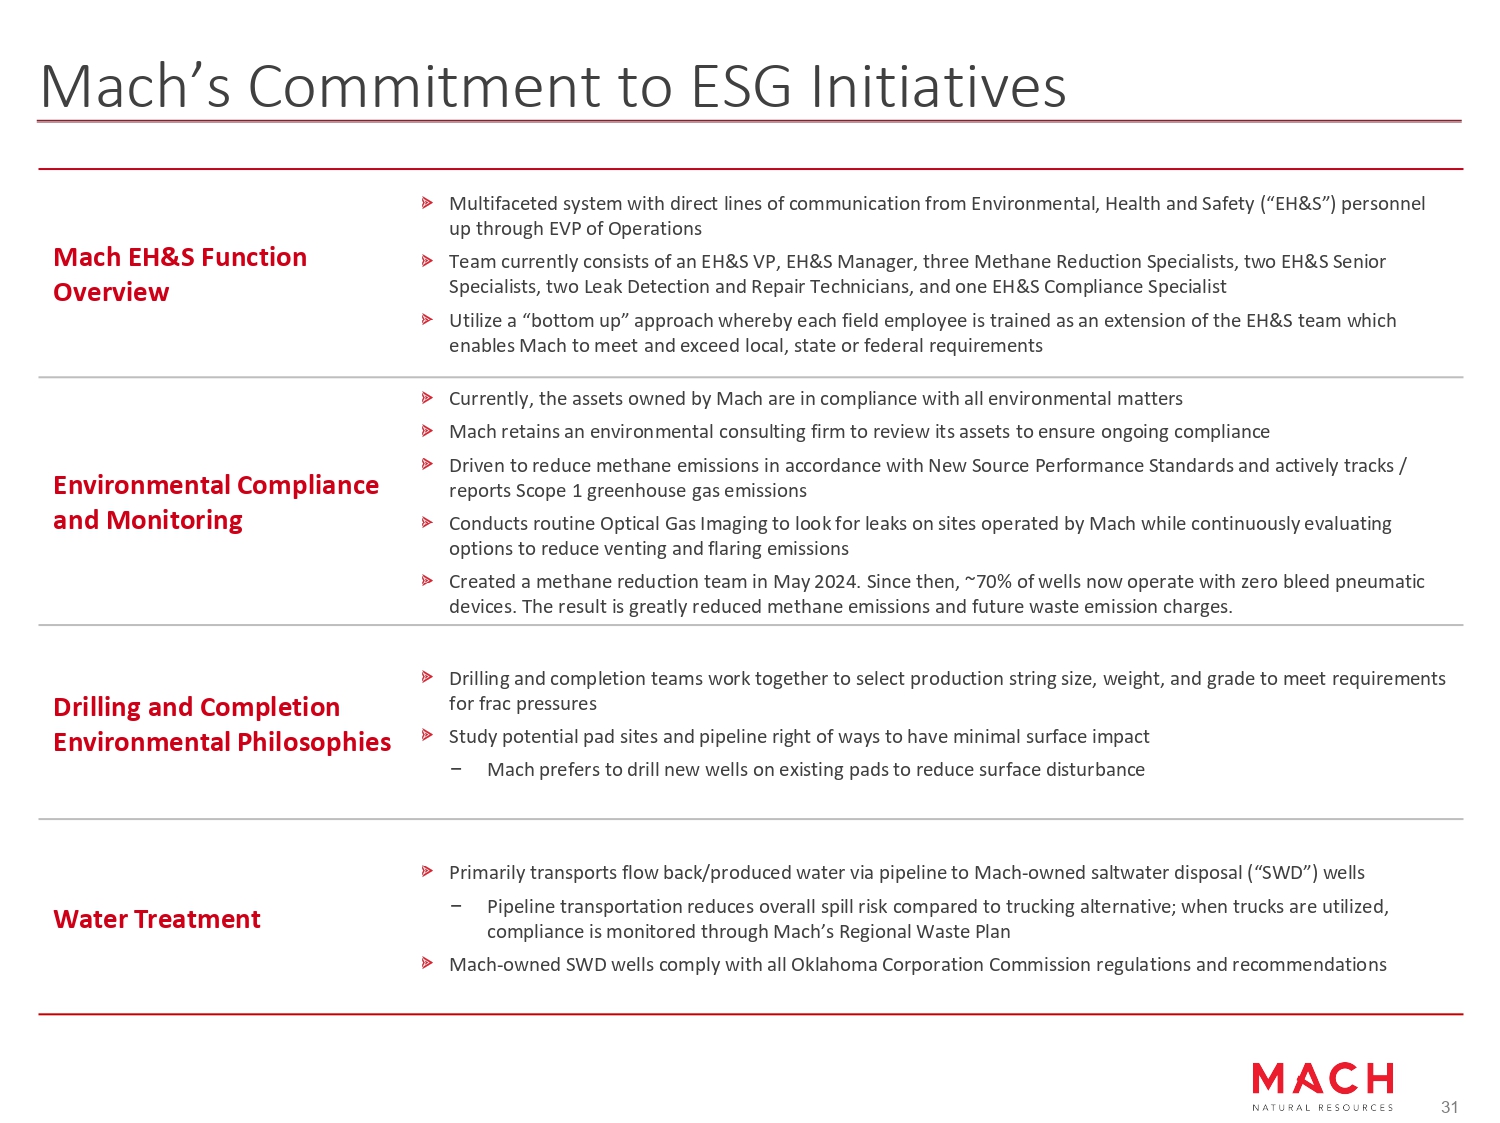
Mach’s Commitment to ESG Initiatives Multifaceted system with direct lines of communication from Environmental, Health and Safety (“EH&S”) personnel up through EVP of Operations Team currently consists of an EH&S VP, EH&S Manager, three Methane Reduction Specialists, two EH&S Senior Specialists, two Leak Detection and Repair Technicians, and one EH&S Compliance Specialist Utilize a “bottom up” approach whereby each field employee is trained as an extension of the EH&S team which enables Mach to meet and exceed local, state or federal requirements Mach EH&S Function Overview Currently, the assets owned by Mach are in compliance with all environmental matters Mach retains an environmental consulting firm to review its assets to ensure ongoing compliance Driven to reduce methane emissions in accordance with New Source Performance Standards and actively tracks / reports Scope 1 greenhouse gas emissions Conducts routine Optical Gas Imaging to look for leaks on sites operated by Mach while continuously evaluating options to reduce venting and flaring emissions Created a methane reduction team in May 2024. Since then, ~70% of wells now operate with zero bleed pneumatic devices. The result is greatly reduced methane emissions and future waste emission charges. Environmental Compliance and Monitoring Drilling and completion teams work together to select production string size, weight, and grade to meet requirements for frac pressures Study potential pad sites and pipeline right of ways to have minimal surface impact – Mach prefers to drill new wells on existing pads to reduce surface disturbance Drilling and Completion Environmental Philosophies Primarily transports flow back/produced water via pipeline to Mach - owned saltwater disposal (“SWD”) wells – Pipeline transportation reduces overall spill risk compared to trucking alternative; when trucks are utilized, compliance is monitored through Mach’s Regional Waste Plan Mach - owned SWD wells comply with all Oklahoma Corporation Commission regulations and recommendations Water Treatment 31
32